

Are Millennials Doing Fine? Homeownership
Not great, not dystopian

I became interested in the intergenerational rates of homeownership after reading a few pieces written by Jean Twenge, the social psychologist. She wrote a great book called Generations. I don’t love the theoretical underpinning of the book (it’s a bit too simplistic in its view of technological progression, imo), but it’s full of great graphs. She also wrote a piece for the Atlantic, “The Myth of the Broke Millennial.” Here’s what she says in the Atlantic regarding Millennial homeownership:
A house is perhaps the most tangible embodiment of the American dream. Millennials’ housing woes have featured prominently in media accounts of the generation’s economic (and life) problems. “There should be a Millennial edition of Monopoly where you just walk around the board paying rent, never able to buy anything,” a Twitter comedian who goes by “Mutable Joe” joked in 2016. BuzzFeed ran a story last year on 24 “ways Millennials became homeowners,” filled with decidedly sui generis anecdotes. One described someone who’d been hit by a truck and won a lawsuit, covering their down payment. Short of getting concussed by a semi, the article suggested, Millennials had little chance of becoming homeowners.
But contrary to that narrative, Millennials’ homeownership rates in 2020 were only slightly behind Boomers’ and Gen Xers’ at the same age: 50 percent of Boomers owned their own home as 25-to-39-year-olds, compared with 48 percent of Millennials, hardly a difference deserving of headlines or social-media memes…These are national figures, and the picture will vary from place to place. (Housing has not been a bargain in New York City, for instance, where a very large number of Millennial journalists live.) But on the whole, Millennials have not been economically unlucky as to homeownership—if anything, the reverse is true.
I think this is a popular facing pull from her book, which states:
Well, a lot of Millennials must have forgone brunch, because their home ownership rates are only slightly behind Boomers and Gen X’ers at the same age. The figures are nearly identical: 50% of Boomers owned their own home as young adults, compared to 48% of Millennials. Thus only about 5% fewer Millennials owned houses than Boomers at the same ages, hardly the stuff of headlines or social media wars…This small difference also has a very logical explanation: More Millennials went to college and graduate school, so they started their careers later than Boomers and Gen X’ers. They are also likely to live longer. With the entire trajectory of adulthood slowed down, it makes sense that Millennials took a few more years to buy houses than previous generations.
In short, Millennials’ economic outcomes are even better than they look. These numbers compare Millennials to previous generations at the same age, but the path to adulthood has considerably lengthened with the slow-life strategy. With Millennials taking longer to begin making money, comparing them at the same age may not be accurate or fair. That alone likely explains the small wealth gap with older generations found in the Federal Reserve analysis and the small difference in home ownership.
Below is the figure. Looks like we have small gaps in homeownership, at about 50%

This seems a little weird to me for a few reasons. First, 25-39 is a long time to measure the rate of homeownership, particularly since you’ll get lots of right censoring in the Millennial data - only one birth year in this group has age 39 data, while you’ll have nine waves of age 39 data for the Boomers and Gen X’ers.
Twenge also mentions that Millennial lives begin later, so the small gap looks even better. I thought that the early 20s was also a bit of a strange time to make comparisons, but why not restrict the age range to a early-ish period of adulthood where one could make more sturdy comparisons across generations - such as the early 30s?
Below I look at birth cohort trends of folks aged 30, 31, 32, 33, 34, and 35 using Census Longform and American Community Survey (ACS) data from IPUMS. I use 1950, 1960, 1970, 1980, 1990, and 2000 Census waves, as well as annual ACS waves between 2001 and 2021. I use person weights and information on whether an individual owns a home. This will “double dip” for married couples who own homes, but that seems to be a reasonable decision.
Aggregate Trends in Homeownership by Birth Year
Below are trends of homeownership, by age, by birth year.

The horizontal dashed lines show the most recent observed age-by-cohorts. What do I see?
There has been a pretty straightforward decline in home ownership rates between birth cohorts from 1945 to 1980, from about 73% to about 55% for age 35, and from 62% to 51% for age 31.
From birth cohorts 1977 and onward, there has been a lagged rebound of home ownership. It looks like for 35 year olds, home ownership increased by five percentage points between 1980 and 1985 cohorts. The rebound occurred later and was smaller for 30 year olds.
And yet, the rebound got us to the linear downward trend that occurred between 1945 and 1970 cohorts. The 1970-1980 cohorts cratered in homeownership. Not exactly a super happy trend.
I’m not sure where Twenge’s getting her no-difference comparisons. I suspect that it’s due to the unequal mixture of age groups across the cohorts she measures from the CPS.
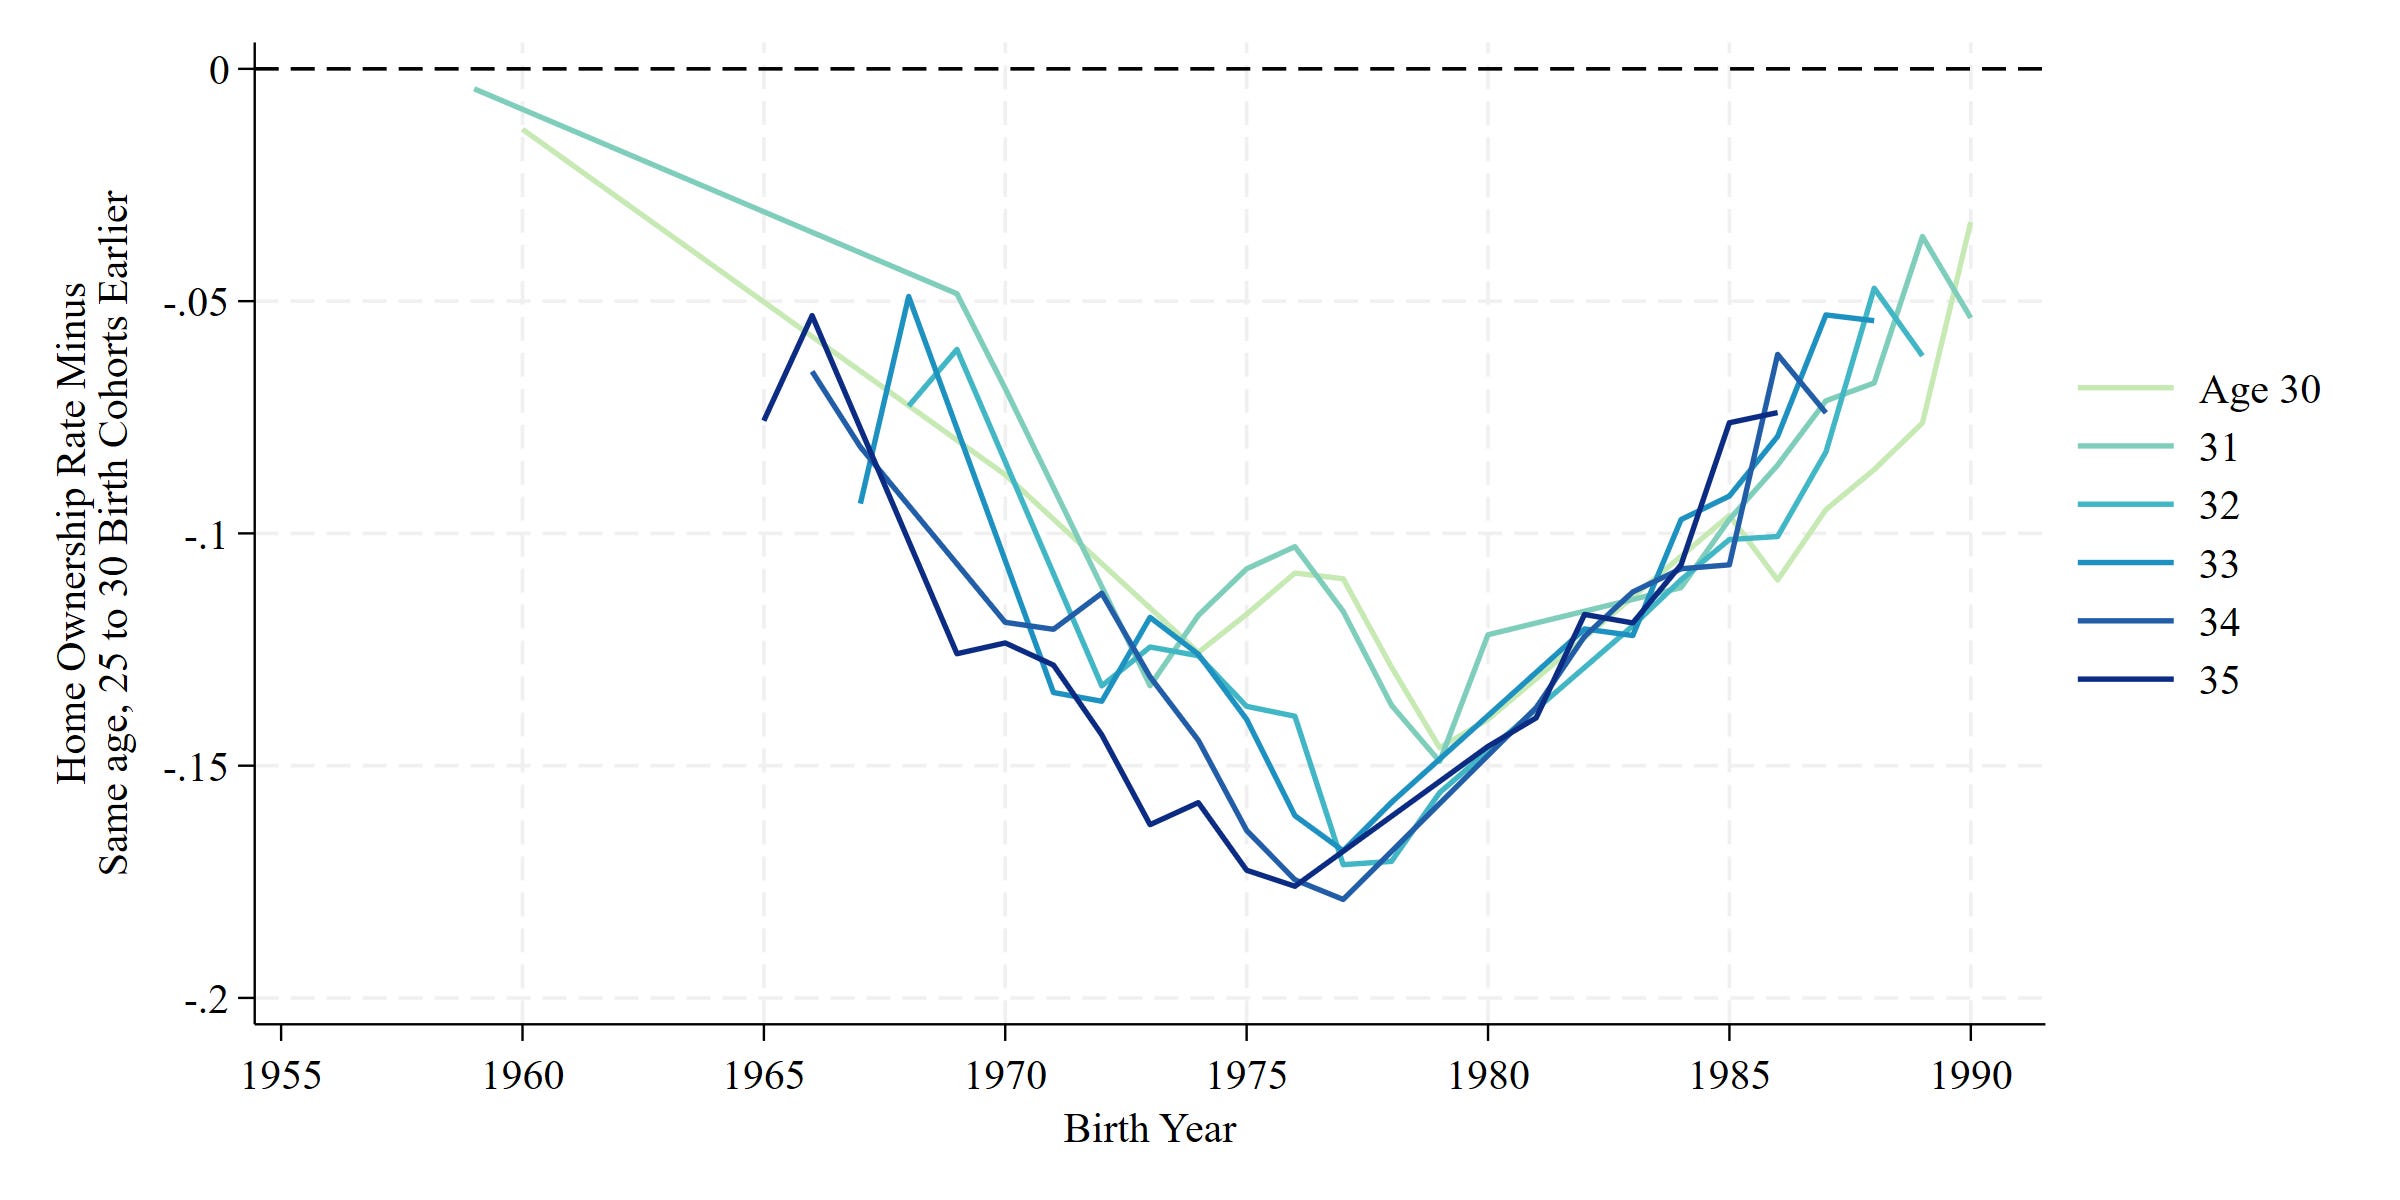
When I think about intergenerational strife, I think about changes between one’s own fortunes and one’s parents. It’s not easy to measure the homeownership rate of individuals and their parents in the Census. So instead, I’ll compare similar aged groups that are spaced 27 to 30 years apart. I think that’s a reasonable, albeit weak, proxy for the homeownership conditions that one’s parents faced.
Below I compare rates with this lag structure to get a sense of how things compare between a birth cohort and the rough proxy of their parents’ cohort.

The dashed horizontal line at 0 would indicate that child and parent generations at the same age have the same home ownership rate. Values below zero mean children have lower home ownership rates than their parents.
What do I see?
Across ages, we see a steady decline of child home ownership rates compared to their parents from 1966 through about 1975, with home ownership rates bottoming out at 12 percentage points lower for children compared to parents.
From 1975 onward for 34 and 45 year olds, from 1985 for 32 year olds, and from 1987 for 30 year olds, there has been a rebound. But the rebound has maxed out at about 4 to 3 percentage points lower compared to parents.
Overall, there has been progress in recent birth cohorts, but Millennial children obviously lag behind their parent's generation in terms of homeownership. It’s pretty obvious to see this when you make comparisons across more tightly similar groups.
Education Gaps?
Are we seeing major differences across education groups? Below I replicate the first graph among those with a college degree of more and those with a high school degree or less.
College

High School or Less

Obviously the cratering of wellbeing has been much worse for those with less education. But we see the same trends for both.
No how about the parent-child comparison?
College

High School or Less
Again, way worse for those with less education. Look at the difference in y-axes! For both groups, we see a rough improvement from 1980 onward. But I just don’t see findings that suggest that folks in recent generations are doing just as well with home ownership as their parents. Maybe I’m missing something?
What Can We Conclude?
Twenge is incorrect to conclude that recent birth cohorts are doing functionally as well as their parents in terms of homeownership.
Twenge likely reached this conclusion by comparing groups with different age mixtures and also different experiences and life course expectations.
Doom proselytizers are incorrect when arguing that things are getting worse, worse, worse. Cohorts from 1980 onward have had a bit of improvement, but still are doing substantially worse.
A modest percentage point at the population level can be highly consequential. If four percent of Millennials are behind pace of their parents, that can translate into just under 3 million people. That’s the same size as Denver, which has four professional sports teams.
Education matters and stories on Millennials that focus on the doom of those with high quality college degrees are probably worthless. The real deterioration is happening among those with less education. There’s probably a ton of within-education stratification I’m missing among recent cohorts.
It remains to be seen whether the optimistic rebound just pulls us back to a previous bad trend or whether we can push forward, with Gen Z owning homes at rates above their parents. I’d be shocked if the more optimistic outcome occurred, but I hope I’m wrong!