

Inequality Quick Hits
Wealth inequality is bad. Young people are having a rough go, but for reasons that are different than the zeitgeist claims

Be Skeptical of Intergenerational Wealth Change
Every now and then you’ll come across an optimistic article saying something along the lines of, “You, the pessimistic fool, should increase your numeracy and learn that younger generations are shockingly rich.”

The bloggers at Economist Writing Every Day , Noah Smith, and Marginal Revolution kind of have this market cornered.
There are definitely dork status games built into these kinds of arguments - if you’re a lame too-quantitatively oriented and too-online kind of person (aka me), you feel pressure to base your conceptions of the world in empirical reality and to avoid those wretched “vibes” that are developed through misunderstanding of reality, sensationalistic clickbait news stories, and social media.
Well, except sometimes quantitative empirical reality is really tough to get right! James Hawkins has a nice and short policy brief about the dataset that we use to make claims about between-generation changes in wealth.

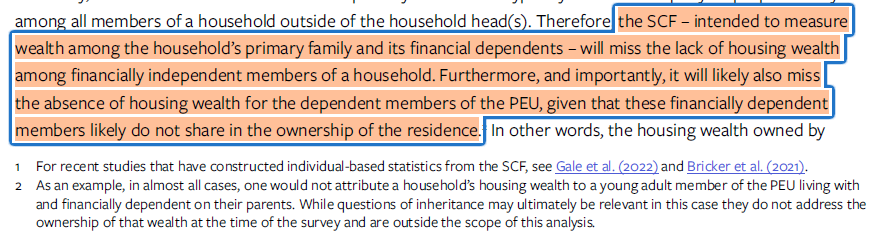
The issue with the Survey of Consumer Finances (SCF) is that it probably misses a growing share of young people who are not household heads. Those folks will get wealth measures missed or mixed up.

Adult children living at home are excluded by surveys like the SCF:

It is difficult to fully determine wealth comparability of young people who are household heads and those who are, for example, living with their parents. Do these groups hold similar amounts of stocks? One dimension of wealth where they will differ: housing. Housing is especially important for young adult wealth, accounting for around 30% of total wealth among folks under 35.


We are going to get a fairly funky picture of wealth if we’re missing the group of zero-housing wealth of those living at home. And we’re going to have trouble with trends if such groups are changing in their prevalence over time.
One of the more important figures in this report: the gap between household and person homeownership rates among young people.

Look at the red versus yellow lines. These show the home ownership rates when you measures folks in certain age buckets in two different ways. The yellow line: taking households headed by folks in these age buckets. We see a rise in 18-24 home owners over time when we focus on household heads. But the red line takes all people in these ages, regardless of whether they’re a household head or not. Here we see stable and low home ownership rates among people aged 18-24, and declining home ownership rates among those aged 25-34. Notably, the gap between these lines is growing over time, meaning more people 34 and under are not household heads (e.g. living with parents, or some other equivalent arrangement). The SCF looks more like the yellow line than the red line.
Thus, we’re getting a growing divergence of the real home ownership rate among young people and the young people’s wealth captured in surveys like the SCF.

So … young people are probably not historically wealthy. They’re probably historically living with their parents.
In fact, there’s a pretty strong divergence over time between person level home ownership and home ownership in the SCF. Here we’re looking at the ratio of home ownership between the Current Population Survey (CPS) person-level and the SCF household level.

Through the 1990s, the two were nearly aligned - home ownership in the CPS person was 95% that in the SCF. By 2019 - 2022, it was 87% to 88%.
Overall conclusion.

Score one for the pessimists.
Too Much Wealth Inequality I

The Wall Street Journal has a jarring story based on a new report by Gabriel Zucman.
The wealthiest have gotten richer, and control a record share of America’s wealth. New data suggest $1 trillion of wealth was created for the 19 richest American households alone in 2024. That is more than the value of Switzerland’s entire economy.
It took four decades for the top 0.00001% of Americans’ share of total U.S. household wealth to grow from 0.1% in 1982—when 11 households made up that rarefied group—to 1.2% in 2023, according to an analysis by Gabriel Zucman, an economist at the University of California, Berkeley and the Paris School of Economics.
In one year, by the end of 2024, the share of total U.S. household wealth for the modern 0.00001%—those 19 households—jumped to 1.8%, or about $2.6 trillion. That is the biggest one-year increase on record, according to Zucman.
A devastating graph:

19 households hold almost 2 percent of all wealth. Look at the rapid rise since 1980. And look at the post-pandemic escalation. Using the very scientific method of holding my fingers on my screen, the growth post-2020 is equivalent to the growth between 1990 and 2020.
An escalation of billionaires, driven by the stock market:
Wealth managers say the surging stock market in 2024 supercharged wealth creation at the top, following already sizable gains the prior year. Together, those two years made for the S&P 500’s best consecutive years in a quarter-century. (Markets have fallen since President Trump unleashed a global trade war, dramatizing the volatile nature of wealth for the richest of the rich. With much of their wealth tied up in the stock market, their net worth can swing by billions daily.)
Those in Zucman’s research on the top 0.00001% in the U.S. are worth at least $45 billion per household and include Elon Musk, Jeff Bezos, Mark Zuckerberg, Bill Gates, Warren Buffett and private-equity investor Stephen Schwarzman. Other researchers have dubbed those with around that magnitude of wealth “superbillionaires.”
The growth of wealth among the rich has minted new billionaires across the globe, and especially in the U.S.
JPMorgan Chase’s private bank estimates U.S. billionaires numbered nearly 2,000 last year, up from about 1,400 in 2021, when it began tracking billionaires. Wealth-data firm Altrata, meanwhile, estimates the figure at 1,050 billionaires in 2023, the most recent year for which it has data, up from 975 in 2021. Altrata pegs their total wealth in 2023 as approaching $4.9 trillion.
When you’ve even lost the WSJ comment section, you know it’s bad:
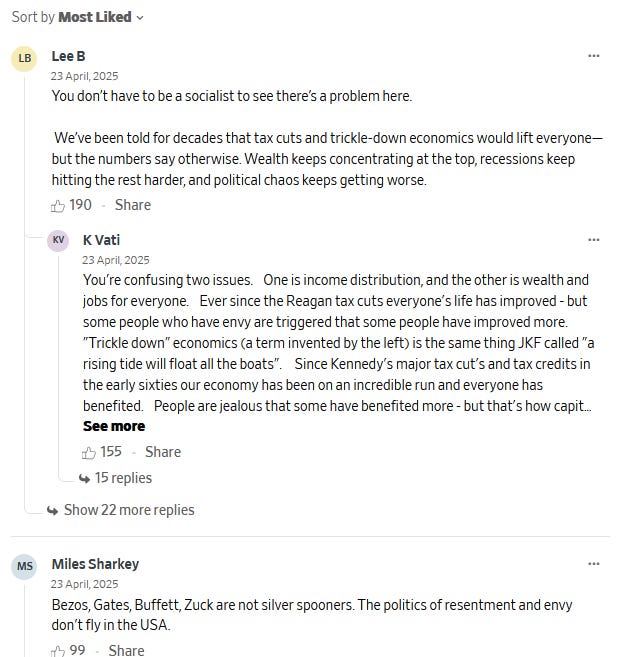
“I’m no communist but this is bad” has 2X the upvotes of “don’t be resentful and envious of glorious Bezos.”
Too Much Wealth Inequality II
The website Realtime Inequality tracks a variety of inequality trends. The most interesting to me is the trend in wealth inequality. Particularly, the “share” held by different groups is relevant for wealth: think of every year as having $100 and 100 people. How much money does the one richest person have? How much money do the 50 poorest people have?
Let’s compare the share of total wealth held by the wealthiest 0.01% (e.g. the top 1 percent of the top 1 percent) versus the bottom 50%.

The green line is the bottom 50%, the purple line the top 0.01%. Through the early 1980s, the amount held by these two groups were pretty similar - about 1% of all wealth for the bottom 50%, about 2% for the top 0.01%. There’s been stagnation at the bottom (although people will try and tell you that there has been growth in recent decades — but that’s mostly a recovery to baseline following the Great Recession) and escalation at the top. In 2024, the top 0.01% holds 11.5% of all wealth and the bottom 50% holds … 0.9%.
The top 0.01% population increased from about 15,000 in 1979 to about 25,000 in 2025. The average wealth increased from about $30,000,000 (2023 dollars) in 1979 to about $630,000,000 in 2025 (2023 dollars). As a group, the total wealth gain has been 15,000,000,000,000 (15 trillion).
Of the bottom 50%, the population increased from about 71,000,000 to 125,000,000. The average wealth increased from about $2,500 to about $9,000.
My gut says that wealth inequality really benefits from the difficult of exponential thinking.

One billion is SO MUCH more than one million. One trillion is SO MUCH more than one billion. This was brought up every now and then during the early days pandemic - folks talked about the difficulty of understanding the wide range of risk that resulted in superspreader events. I suspect that the lack of outrage over extreme inequality is based in the natural inclination of people to think linearly. That is a major benefit if the wealthiest Americans are outpacing everyone not only by billions, but by trillions. The sheer scale if this economic domination is difficult to comprehend, thus enabling its escalation.
The New College Grad Gap?
Derek Thompson, journalist at the Atlantic, has a new article about rising unemployment among recent college graduates. It’s organized around this graph and a variety of stories of recent graduates struggling to find jobs.

We see that since 2012, the gap between total unemployment and recent college graduate unemployment has reversed - recent grads used to have lower unemployment. Since 2015, the levels have equalized then reversed.
Thompson’s interpretation:
Consider, then, a novel economic indicator: the recent-grad gap. It’s the difference between the unemployment of young college graduates and the overall labor force. Going back four decades, young college graduates almost always have a lower—sometimes much lower—unemployment rate than the overall economy, because they are relatively cheap labor and have just spent four years marinating in a (theoretically) enriching environment.
But last month’s recent-grad gap hit an all-time low. That is, today’s college graduates are entering an economy that is relatively worse for young college grads than any month on record, going back at least four decades.
The strong interpretation of this graph is that it’s exactly what one would expect to see if firms replaced young workers with machines. As law firms leaned on AI for more paralegal work, and consulting firms realized that five 22-year-olds with ChatGPT could do the work of 20 recent grads, and tech firms turned over their software programming to a handful of superstars working with AI co-pilots, the entry level of America’s white-collar economy would contract. The chaotic Trump economy could make things worse. Recessions can accelerate technological change, as firms use the downturn to cut less efficient workers and squeeze productivity from whatever technology is available. And even if employers aren’t directly substituting AI for human workers, high spending on AI infrastructure may be crowding out spending on new hires.
But let’s look at the underlying data:
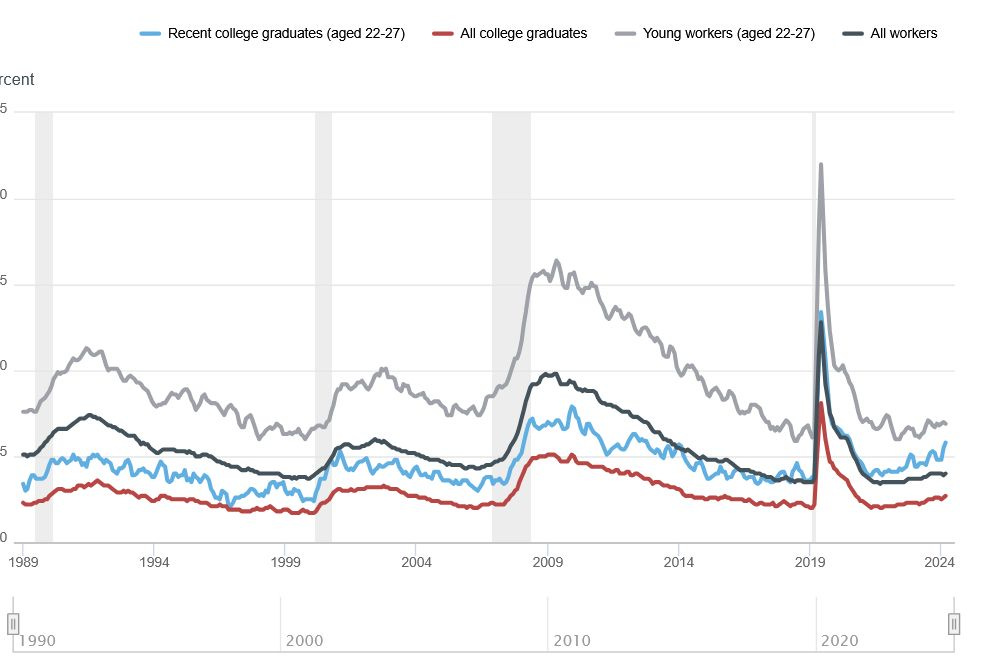
The blue line is recent grads. The black line is all workers. The gray line is all young worker. The red line is all college graduates. What we’re seeing is rapidly declining unemployment among all workers and especially among all young workers. For young college graduates, unemployment was already pretty low. Since the pandemic their unemployment rate has increased slightly. All college graduates remain very low.
I don’t think we’re seeing the seeds of an AI apocalypse. I think we’re seeing the fruits of a labor market that has been unusually tight between 2012 and 2022.
Katherine Newman and Elisabeth Jacobs have a great book from a few years ago documenting this era.
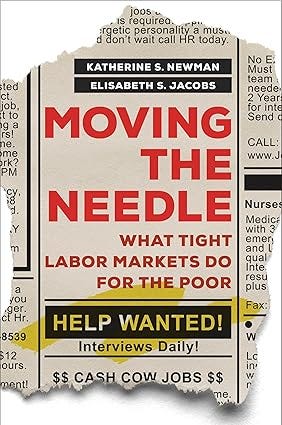
Book description: Most research on poverty focuses on the damage caused by persistent unemployment. But what happens when jobs are plentiful and workers are hard to come by? Moving the Needle examines how very low unemployment boosts wages at the bottom, improves benefits, lengthens job ladders, and pulls the unemployed into a booming job market.
Drawing on over seventy years of quantitative data, as well as interviews with employers, jobseekers, and longtime residents of poor neighborhoods, Katherine S. Newman and Elisabeth S. Jacobs investigate the most durable positive consequences of tight labor markets. They also consider the downside of overheated economies that can ignite surging rents and spur outmigration. Moving the Needle is an urgent and original call to implement policies that will maintain the current momentum and prepare for potential slowdowns that may lie ahead.
I suspect AI will be bad for recent young graduates, both in terms of its negative effect on literacy, its inherent anti-humanism, and its potential good enough cost savings for business. But I don’t think that the Fed Data shows what Thompson claims it to hold.
A much more interesting tab in the Fed Data is labor market outcome by college major. Fellow sociologists, divert your eyes:

As a discipline, I really don’t understand how our poor results here aren’t the major five alarm fire focus of our national organizations. I know that salaries aren’t everything, but I think that we need to be realistic about (1) the major inequality within college and (2) the rising importance of economic outcomes among modern students. Ignoring these issues seem like a slow-moving death. Earnings outcomes aren’t always about skills and knowledge developed in the classroom. Often these are the result of institutionalized connections between school and work. One would think that a national organization with high membership dues might expend lots of resources to make such institutionalized connections for our discipline.