

Monday- July 8 - Five Good Reads
Mortality and Income, Big Data, Urbanization Demographic Changes, Rural Penalties Across the Lifecourse, Teen Peers and Depression

1. The impact of income definitions on mortality inequalities

A neat exercise of a paper - income predicts mortality. But there are lots of ways that you can measure income. The authors think of two main ways that income definitions can vary -
Person vs. household. Do we compare Joe, who makes $25,000 a year, to Jane, who makes $10,000, or do we compare household 1 with Joe and Jane versus household 2 with Jack and Jennifer. People pool income at the household level, so someone with a seeming zero income might have more resources available if they’re married to a high earner.
Age specific versus population percentiles. A 20 year old makes $35,000. That might make them a rich 20 year old, but they’re not a rich worker (e.g. 45 year olds are at their maximum earning potential). Do we compare them to other 20 year olds, or to everyone?
The authors use Finnish administrative data (hooray Europe, boo America, for our different standards of high quality administrative data).
A pretty graph showing the different age-specific allocations of folks as high or low income whether measuring at the individual or household level

The authors look at correlations of these different income measures (closer to 1 = measures are functionally interchangeable, 0 = totally unrelated)

Unsurprisingly, the income definitions are more variable for women - there are lifecourse and household and work norms that affect women’s income versus household income locations.
We look at trends in the slopes over age (e.g. how associated are these income measures with mortality at different ages)

The largest differences are for women, household-population versus individual-age specific. I suspect any form of household measure is the most preferable
In total, there are differences in results across different income measurements

..but…don’t get carried away. The differences are pretty small.

A lovely table of results - something I’ll probably copy in my future research

2. The Data Revolution and the Study of Social Inequality: Promise and Perils
An article by the extraordinary Mario Small. This one it theoretical so I’ll highlight a few of the points I thought were most interesting.
Small conducted great research in the pre-big data era, and now conducts research in the big data era. Big data is remarkable, but brings with it several questions and puzzles:

This new era is defined by three core features: speed (giant data can be produced extraordinarily fast - think of the fact that papers on covid started coming out before covid jumped to humans) comprehensiveness (your phones track your every move and if you’re lucky, it’s researchers who get the data. Researchers can follow your movement from building to building, room to room) and cost (internet data is cheap if you invest in some web scraping skills).
Thus, old questions can get new answers, and new questions can get new answers. That’s great.
BUT - there are several perils that need to be taken seriously.
Privacy

Scholars probably shouldn’t follow the Silicon Valley route of devouring individual privacy for personal gain.
Control
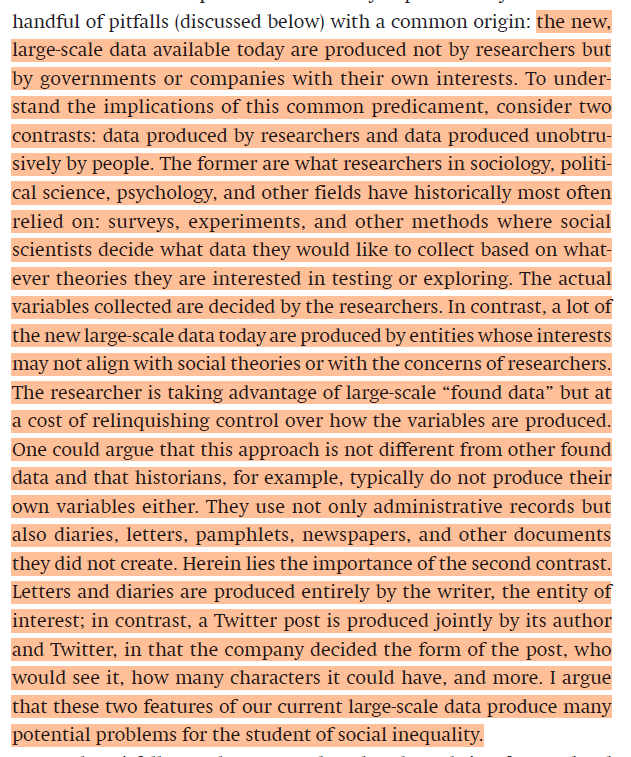
Small uses the digestible Cambridge Analytica example of problems of business control over the data. But Small goes a step further. This point’s so nice I’ll quite it in full
My two cents: there’s a general problem today of a symbiotic relationship between high prestige academia and large / extractive tech companies. Assuming that there isn’t some pro-high status bias in the selection of who gets the proprietary private data is, at best, naïve. Think of the problems of access w the Uber data to researchers who happened to find that Uber was amazing.
Size problems
Small also discusses general problems of massive data - selection and lampposting. e.g. if you stand outside a store and hand a flier to people already heading in to purchase items, you can say your flier is extraordinarily effective. And lampposting refers to simply looking for data in places that are convenient and available to look.
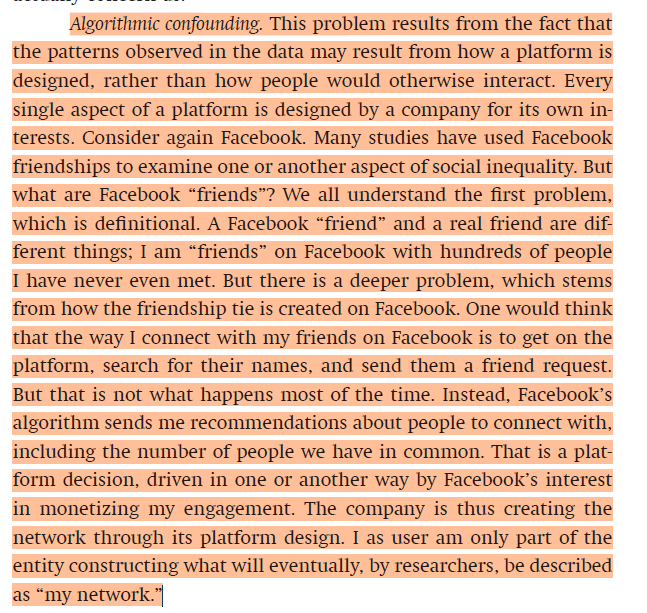
He then talks about algorithmic bias. Again, such a good point that I’ll quote in full.
He then ends with the concept of unobserved influence. e.g. people don’t just interact online. But if we only have twitter data, we only see people interacting on twitter. That probably makes us think that twitter is more influential than it is.
He ends with:
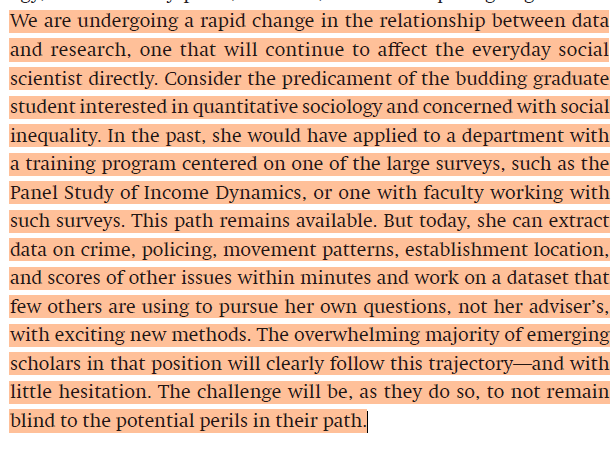
I personally hate internet data and so am restructuring my research interests to require information prior to 1990. I’ll slowly learn the wretched internet skills in the meantime until I can no longer hold out.
3. Neighborhood Change, Gentrification, and the Urbanization of College Graduates

An open access article from the American Economics Association. I thought this article did a great job providing an overview of the changes to demographic compositions within cities over the last several decades. The most interesting points can be summarized by a few interesting graphs.
First, college graduates have moved closer to city centers over the past four decades:
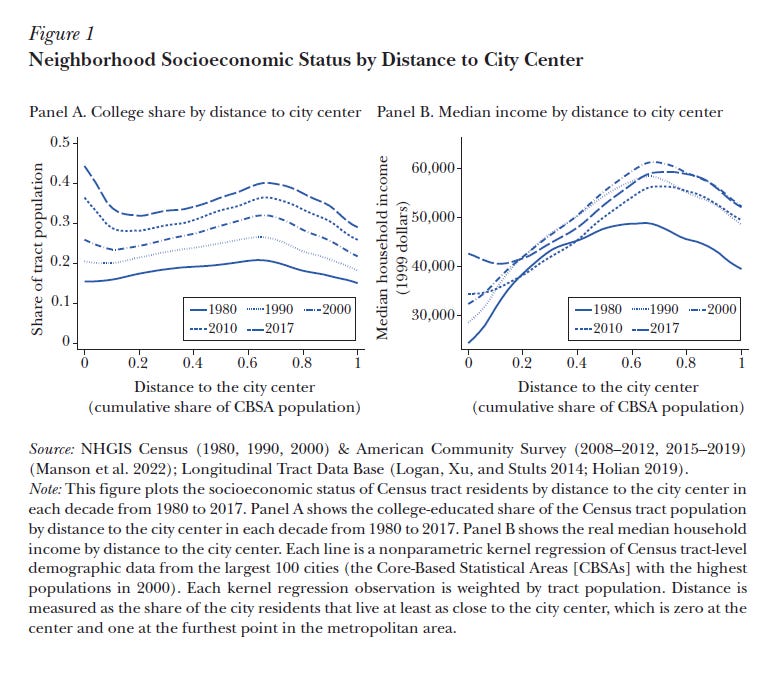
The x-axis is distance to city center (e.g. 0 means you live on top of the Empire State building). The y-axes show proportion of close or far residents with a college degree and the median income of folks who are close and far. In 1980, college grads were just as likely to live near the city center as far away. By 2017, you see that the location with the highest share of college grads was the city center itself. Similarly, you see a rise of city center incomes. Although they tend to be lower income, they are not as dramatically so.
There have been corresponding demographic changes. Namely, city centers became younger and Whiter.

Notice too the slight rise in Black suburbanization in the inner ring suburbs during this time.
The authors go on to discuss the inputs and outputs of these trends. I suspect they’ll be a little out of date by now. But fascinating to see these major changes in urbanization occurring.
4. Residential trajectories across the life course and their association with cognitive functioning in later life
This interesting article didn’t make the biggest splash, but I found it very interesting nevertheless. Older folks in rural and urban areas differ in cognitive health. But just because someone currently lives in a rural place at age 70 doesn’t mean they always lived in a rural place. The authors use panel data to examine residence trajectories among a large sample of European older adults.
What patterns of residence transition do we typically see?

These are “sequence analysis” plots - which show the typical trajectories of groups identified by data-driven statistical processes. For example, in the bottom (b) panel, we see that some folks at age 80 who lived in the Suburbs were living there at age 20 But there were also lots of folks transitioning from city centers and rural areas through age 40.
The authors look at current residence type, as well as early and mid life residence type, and find:

Thus, it is early life residence in rural areas that predicts older adult cognitive functioning. The urbanite who relocates to a farm during retirement years doesn’t seem to face a rural penalty.
This seems obviously true to me. The lag structure between penalties or opportunities and inevitable outcomes is such a complicated and cool puzzle.
5. The Role of Multilayered Peer Groups in Adolescent Depression: A Distributional Approach

For nonacademics this might seem like an “old” article, being published in 2020. But to me, that’s white hot current. I love BK Lee’s research. This article uses a high quality longitudinal dataset of young people, Add Health, and examines the relationship between an adolescent’s depression and the depression of their peers.
They find asymmetrical effects -
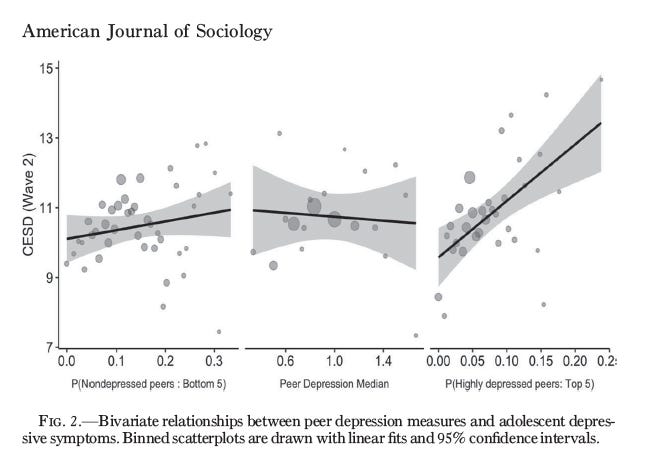
The left panel shows the effect of having non-depressed peers on depression (higher values = more depression). The middle panel shows the typical depression of peers. The right panel shows the effect of having very depressed peers. As you can clearly see - having very depressed peers increases an adolescent’s own depression. But having non-depressed peers doesn’t have an effect!

They then look at a complex mix of relationships that adolescents can form in school - across grades, clubs, within grades. Their conclusion:
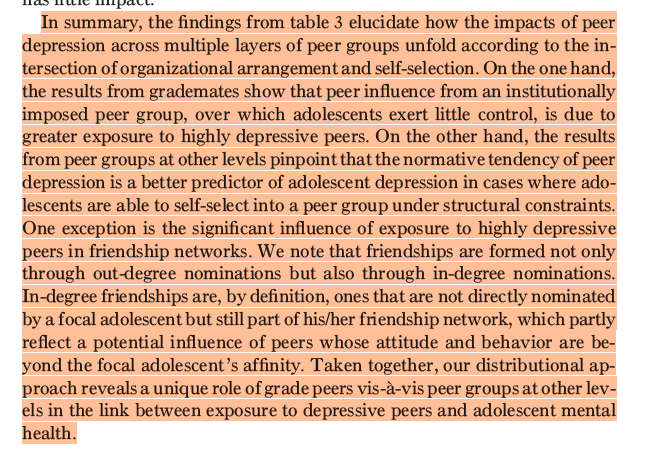
That is - the imposition of highly depressed peers within one’s grade (you’re both assigned to a particular classroom, increasing exposure) boosts depression. But students can also select into other groups to affect depression. There’s a mixture of structural impositions and opting-in and -out that make these peer effects.
Finally, not all peer exposure is made equal. Strong parent support buffers peer effects.

I love this article in part because of how heterogeneous its findings are. The effect of relationships on one’s mental health is, to quite Avril Lavigne, complicated. It’s like a Plinko chip bouncing around a bunch of predictive factors, some of which are in one’s controls and others of which are not.
