

Monday - One Great Read - Poverty Measurement
Many imperfect measures, most are too low


Back in 2020, Shawn Fremstad wrote a fantastic report about poverty measurement. Thought I’d go through it here.
We can begin with the two main basic measurement of poverty, the Official Poverty Measurement (OPM) and the Supplemental Poverty Measurement (SPM).
A Census infographic that shows the differences between the two:

OK, back to Fremstad’s paper.
He really, really dislikes the OPM AND the SPM. He says both are problematic measurements of poverty and, when you look at the details, both are too low.
Official Poverty Measurement - Bad now, bad at the time
The history of the OPM:


This OPM measurement crowded out other conceptual definitions the BLS was developing that were more tailored to place and context:

The typical story of the OPM is that Orshansky found a minimal food threshold, saw that 1/3 of income was spent on food, and so multiplied that minimal food threshold by three. Reality’s a bit worse than that - poor Orshansky is blamed for a lot of corner cutting institutional decision making:

I understand this as - what’s needed to very technically not starve if both a hurricane and a tornado hits.
It gets worse - this soon-to-be OPM threshold was designed to describe the hard core poor

It seems that the focus on the hard core poor was to make sure that the War on Poverty was effective, and to address the then-popular idea of the culture of poverty (e.g. some people are poor because they don’t have middle class values). Nixon comes along and says: just adjust this measure to inflation. Horrifying Orshansky.

Supplemental Poverty Measure - Better, but also bad
The SPM is quite a bit more complex and tries a bit more to get a closer definition of poverty-level incomes:

However, there are tons of problematic decisions and assumptions baked into the SPM.
The SPM doesn’t match particular food quantities, but instead adjusts a particular year-specific percentile of certain consumption items:

Your eyes may also glaze over on details like these, but the point is that such decisions are a tad circular:

e.g. spending is very constrained among low income households, so you might not actually be seeing what folks need to spend on, say food. Or you might be measuring utility spending among folks who need to skip paying a utility bill.
The SPM is lower than the original recommendation, and other swings at poverty
Below, “NAS” refers to the measurement recommendation made by the National Academy of Sciences back in the 90s. We compare the poverty threshold to that set by the SPM:

SPM is consistently 8% - 11% lower than the NAS.
Let’s compare OPM and SPM to 1/2 the median income (a relative poverty measure often used in cross-national research): We’re looking at a family of four, 2 parents and two kids.

OPM says being poor in 2018 was $25,500. Relative poverty (right column) says $40,000.
How about the following: ask the public: what’s the minimum a family of four can live on to get by in your community. What numbers are given?

People said $58,000 in 2013, over double the OPM and SPM measure. And $25,000 more than relative income.
When you ask people to define the poverty line:

Closer to the relative income measure than either OPM or SPM. Seems like the public would agree that the OPM and SPM are too darned low.
The bundle of goods pricing is insane
Fremstad next walks through some of the decisions made to calculate the costs for necessary bundles of goods in the SPM. Long story short - they’re not terribly realistic.

Food costs assume cooking from raw ingredients and never eating out (an unrealistic assumption for modern society, for people who are mobile). Shelter and utilities - anyone older than 10 should realize the obscenity of these costs. He notes that transportation is the second highest expenditure item in lots of families but isn’t factored in. That means that a typical house has $385 left over after shelter, utilities, food, and clothing. And that “other” includes transportation. Anyone over the age of 10 / who has ever once left Manhattan should realize the absurdity of not factoring in car costs.
Health care and childcare:

He ends with a bunch of recommendations. If it were just me, I’d simply do 1/2 median income. If we need a dumb and blunt measure that anyone can calculate, I’d say that’s the one.
The SPM has been partially updated
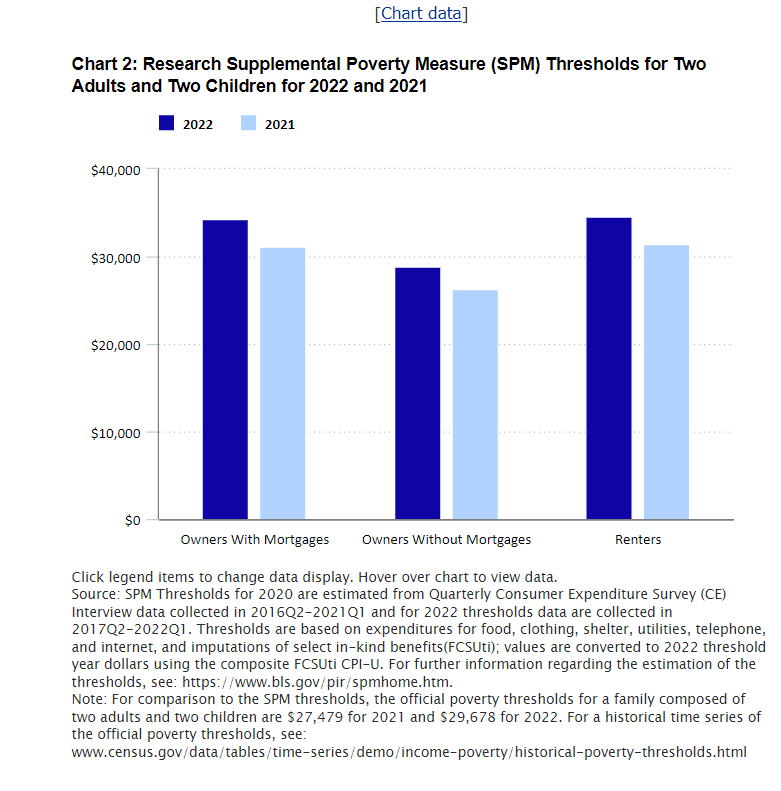
In 2021 the Census Bureau updated its SPM measurement, partially aligning with Fremstad’s recommendations:

These changes raised the thresholds for poverty
Why this matters
This article matters for a number of important reasons. But one is that there are lots of folks out there that say that America has solved poverty.
Take this article by Noah Smith
Smith’s setup:

Then he argues:

Why would anyone argue against functionally zero poverty?

I hope that the discussion above motivates you to at least briefly consider that arguments like Smith’s, rooted in Burkhauser, might be a bit silly.
The Burkhauser team’s argument that American functionally has no poverty today shows up in many odd places. I have noticed a lot of pretty serious policy folks and public facing thinkers throwing these kinds of graphs around in recent years.
In the paper, Burkhauser et al argue that we need a new, better definition of poverty to determine whether Johnson’s War on Poverty was a success. They start with a quote by Johnson:

They take this line - 20% of the American population in 1963, as an absolute anchor of poverty. Anyone whose post-tax and -transfer income above this 1963 bottom 20% line, inflation adjusted, should be considered not-poor.
Their definition of poverty is organized around three pillars: anchor to the 1963 line, that line should define poverty hereafter (inflation adjusted), and it should include adjustments via taxes and transfers.

The steps the authors take (my opinions in parentheses): anchor poverty to being in the bottom 20% of the 1963 income distribution (unreasonable), they use an alternative inflation adjustment (reasonable, they choose a good one), incorporate taxes and transfers into income definitions (reasonable), also include health insurance (unreasonable, health insurance is a mess of a system), adjust incomes based on household sizes (reasonable).
Here’s the thing about the Burkhauser paper - they construct an extraordinary poverty measure, which they call the relative fmp (fmp=full measure of poverty). This anchors their poverty measures to the median household. We see a real, but modest, decline in relative fmp since the early 1960s:
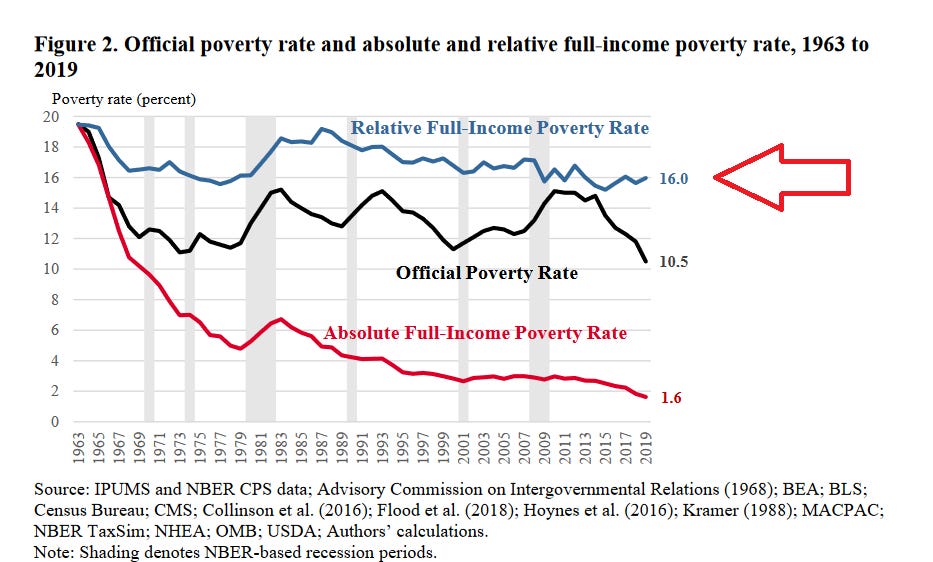
But the action in the paper that has escaped into the public, and one of the findings they emphasize in the abstract, is the absolute fmp, which anchors compared to the 1963 low income threshold. That’s the finding claiming that poverty in the USA today is under 2%.
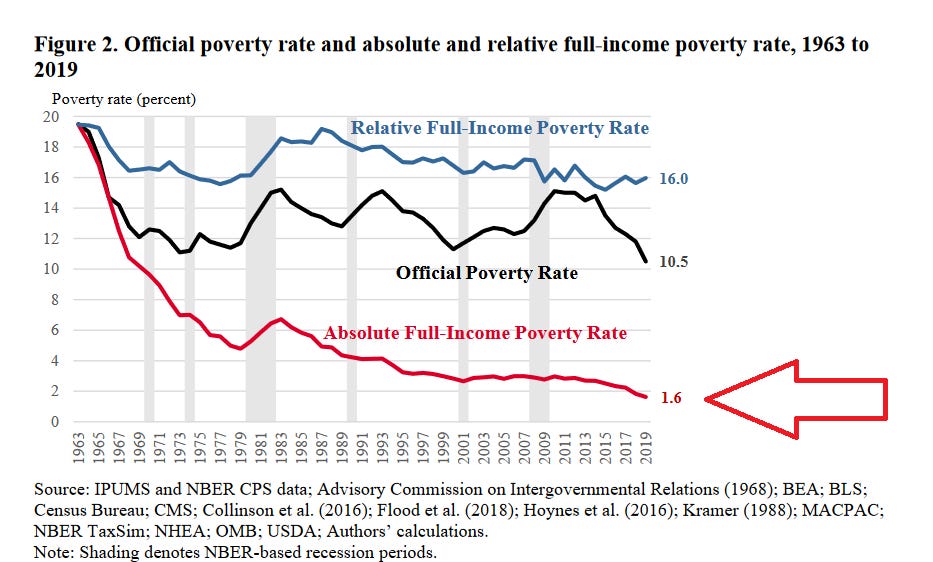
I mean, such an absolute measure is quite silly when we think of what it actually means applied to the modern day. They even (unintentionally, I believe) show how silly it is in the paper!

This graph shows two histograms of earnings distributions. I hope that after reading the above discussion, you might also think that the argument that a household income of $10,000 a year in 2019 is not-poor is a bit silly. Notice too the last line of the footnote: “income levels above $120,000 are not shown.” I suspect that the x-axis would need to be increased quite a bit to get to the equivalent max that is shown for 1963. It also kind of suggests a larger share of folks in relative poverty in 2019 than actually are.
One last point - why anchor poverty rates in the early 1960s? Why not at the moment before the horse is domesticated? Couldn’t you say: poverty refers to access to less than 1,000 calories and a shovel. That translates to roughly $100 / year. Therefore almost nobody globally is poor. Conceptually, anchoring poverty limits to a particular time period’s threshold makes sense in some ways. But if it seems silly to anchor poverty to a pre-horse domestication time period, perhaps historical anchoring itself is a suboptimal decision.
Anyways, poverty is one of those weird concepts that is talked about a lot, that has a very real substantive meaning at its core, but hinges so much on weird conceptual definitions. I’d just say that my main takeaways from writing this up:
Both the OPM and SPM have odd histories that probably result in modern poverty lines set either much or a bit too low.
It seems like the history of poverty definitions has routinely been rooted in attempts to match up ideas of basic consumption needs with particular minimal income levels.
Please be very skeptical of claims that American functionally has no poverty.