

What the heck is happening to inequality III: Was there really a vibecession?
Color me skeptical

In this post I’m going to take a bit of a detour from inequality itself to think a bit about public views about inequality, their economic wellbeing, and how the economy is doing.
The decline of inequality is part of a broader set of positive changes to the functioning of the labor market over the past 10 or 11 years. Median incomes have increased, income inequality has declined, unemployment is low, the population-to-employment ratio has risen. Yet these changes don’t match with views held by folks, especially in the post-pandemic recovery. I believe Kyla Scanlon came up with the term “vibecession”, which refers to the mood or feelings that folks have about the economy, multiplied across a group, creating a disconnect from perception and reality of economic workings. Noahopinion wrote a nice “vibecession” article that got me thinking about this, and Derek Thompson has beat the drum on this topic pretty loudly, tying it explicitly to inequality decline. He has a recent podcast and Atlantic article on the topic. I’m going to focus on just one narrow aspect that I was a bit skeptical about in this whole conversation.
Consumer Sentiment
All the folks above contrast the improving economic performance, since 2012 and especially in the wake of the pandemic, with cratered consumer sentiment. The University of Michigan has a long-running consumer sentiment index
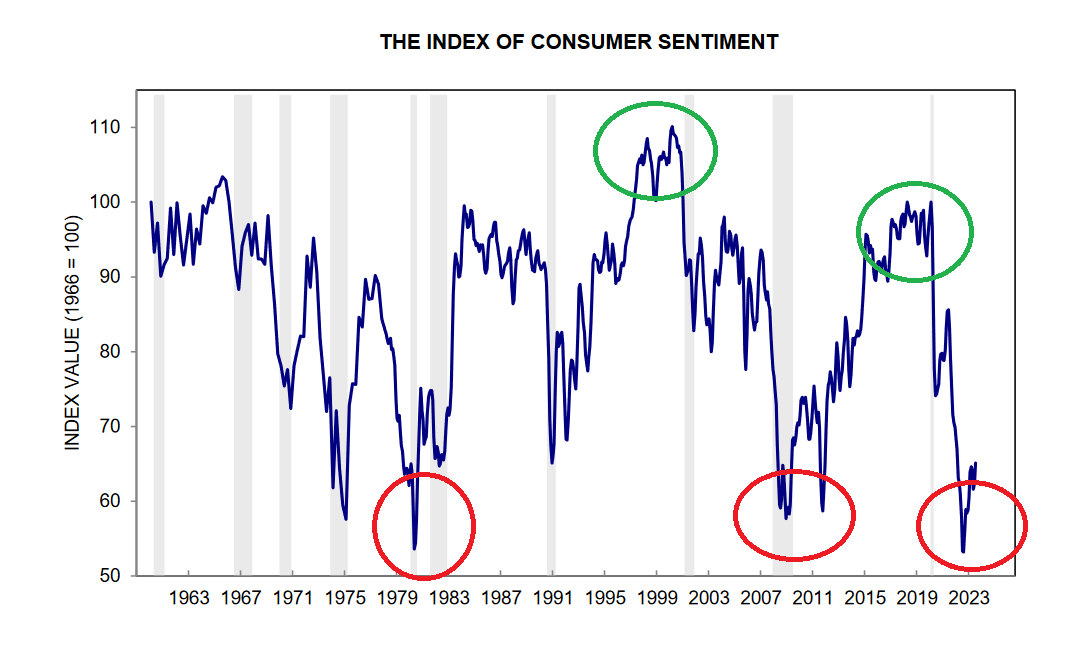
Higher values mean folks are feeling better about economic conditions, lower scores folks are pretty sour on the economy. I put red and green circles in the graph above, and you can see that low points match on pretty well to obviously terrible economic times - the culmination of all the terrible 1970s events (inflation, oil crisis, price controls, etc.) and the Great Recession. The high points also reflect obvious great times - the booming and optimistic late 1990s economy, and the well-functioning economy just prior to the pandemic! Contra the wide pessimism of the 2010s, folks were about as optimistic about the economy at that point as they were in the late 1980s and the early 1960s.
By the way: I’ve never seen how this index was constructed, so below is information on how UM creates the index. Looks like it’s a weighted scale of a bunch of questions about a person’s personal economic wellbeing, whether they think they’ll do well in the future, and also questions about the general economic conditions in the country.

Vibecession
That gets us to the “vibecession.” I’m going to hone in on one figure that seems to have encapsulated the whole discussion, from Noahpinion via Thompson
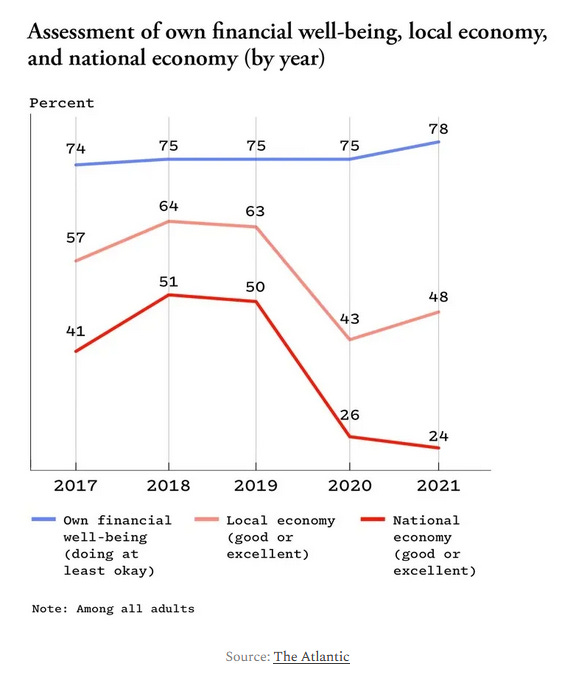
Basic point: since 2019, folks’ personal economic wellbeing has been positive and unchanged, but perceptions of their local, and especially the national, economic conditions have declined significantly. Hence Thompson’s description, “I’m fine, but everything’s awful.”
The data for the graph above comes from the Federal Reserve’s Survey of Household Economic Decisionmaking. I’m using that data for a different project, so I thought I’d check it out!
First, let’s make sure I can replicate the Atlantic’s “Vibecession” graph with my version of the data:

Yup! Looks super similar. So let’s think about what’s going on.
Let’s look at the questions. The green line above is in response to the following:
Overall, which one of the following best describes how well you are managing financially these days?
Response categories are: finding it difficult to get by, just getting by, doing ok, living comfortably.
The “nation” and “local” lines are in response to the following:
In your community / this country ‐ How would you rate economic conditions today:
Response choices are: poor, only fair, good, and excellent.
I’m not entirely sure about the meaning of the “managing finances” question. Let’s say a person thinks about the combination of their income, expenses, savings, debt management, and lifestyle choices. Let’s say their utility bills increase substantially and restaurant prices increase substantially. This person isn’t going into debt, but no longer eats out or saves for their child’s education. Their life got a bit worse and their financial situation worsened, but they could honestly answer that they’re doing ok (they’re not going into debt) or are living comfortably (still food on the table and lights on, still getting by month to month). Lots of the meaning of “managing finances” might miss changing economic conditions, as life conditions can move within a broad “comfortable” category and still be meaningful - lots of argumentative energy has pushed against consumption inequality arguments along the lines of “today’s poor have dishwashers and cell phones, which would be considered literal magic as close as 150 years ago. Therefore nobody’s poor today.” Or: relative changes are super, super important in the modern era of super-advanced technology and high economic development.
There’s another question in these datasets that asks the following:
Compared to 12 months ago, would you say that you (and your family) are better off, the same, or worse off financially?
You can collapse answer choices into: worse, same, or better. I like this question because it can get at relative changes, even among the “comfortable” in the above question, and it seems to mimic one of the items in the consumer sentiment survey. Let’s compare the relative changes in this question and the “managing finances” question.

We’re looking at changes in percentages relative to the distributions we see in 2014. So values above the y-axis 0 show more people answering that category relative to the percentage of the folks answering in that category in 2014. I see a few things:
The improvement of the pre-covid 2010s era is very real and we can easily see it in both questions. The percentage of folks saying they “comfortably” managed their finances increased by 10, mostly drawing from “difficult” and “just getting by.” This is a major triumph of the 2010s.
Look at the decline of folks doing worse than the year before from 2014-2019. 8 percentage points lower in 2019 compared to 2014. About 6 percentage point increase in folks going the same, and about 3-4 percentage points more folks doing better. Yowza. That’s a major win and a very positive development.
Look at what happened to the “better / worse / same” question from 2019 - 2022. At the start of the pandemic, there was a decline of 8 relative to 2014 of folks doing worse than the year before. That rocketed up and reversed, so that in 2022 the percent of folks doing worse than the year before was 14 percentage points higher than in 2014. You thought above was a yowza? This is a YOW-za!
Finance management was not as changed by the pandemic. The big growth of “comfortable” stuck around…mostly. We see it declined from 14 percentage points higher relative to 2014 to 8 percentage points. We instead see a rise of folks just getting by or having a difficult time.
Folks doing better than the year before cratered during the pandemic. We saw no meaningful decline of folks in this category from 2014-2019. Then it declined by 10 percentage points 2019-2022.
I think the following happened: the economic conditions of many folks worsened during the pandemic. Many of these folks weren’t in the most marginal or insecure positions and so were able to still do, at least, ok. But the sheer magnitude of worsened economic conditions cratered the overall economic sentiment. Which to me seems like a totally reasonable response. Look at the range of “doing worse” between 2019 and 2022: from -8 to about 14 - that’s a change of almost 25 percentage points, a massive amount of folks doing worse than the year before! To chalk that up to “vibes” is probably not accurate.
My nation, my community, and me
What about the gap between folks’ personal finances and their perception of their community (worse) and nation (even worse)? I think the most straightforward interpretation is that these gaps are largest among folks who’ve fared the best.
Let’s look at the gaps in perceptions of the economic conditions of one’s local community and the nation, stratified by folks whose financial management is difficult/just getting by / ok / comfortable:
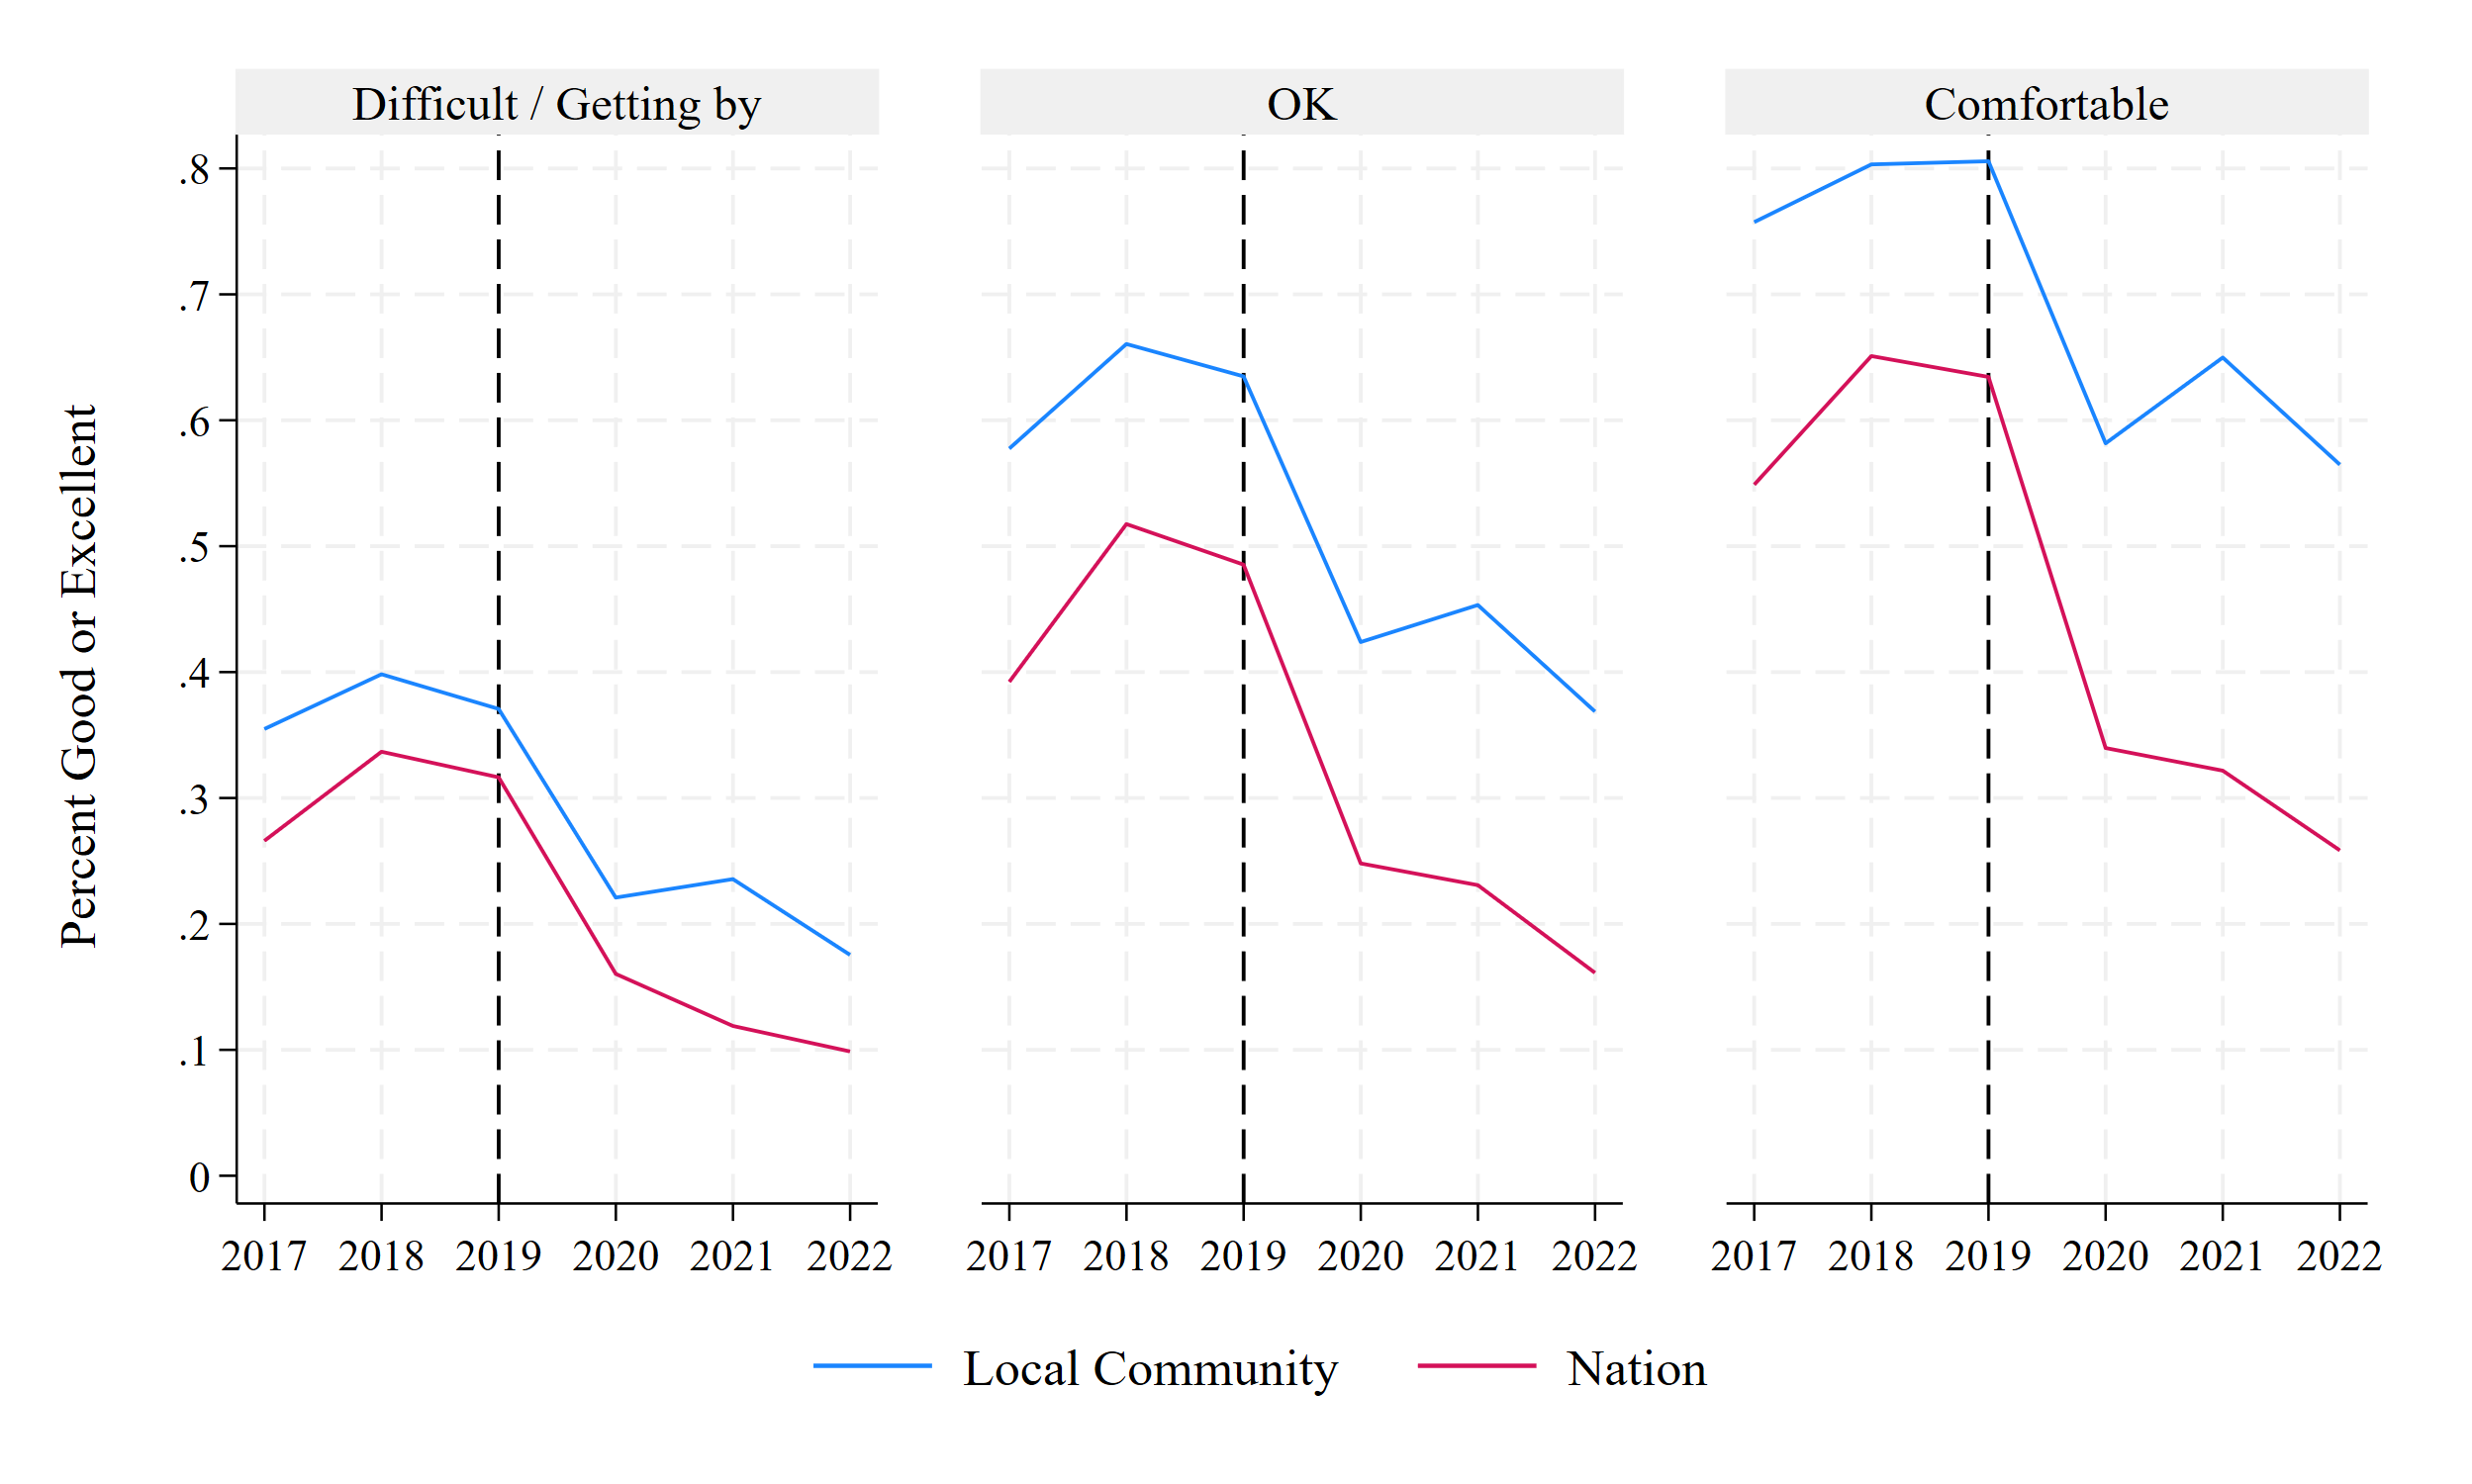
A few observations:
Folks were getting more optimistic about both their community and the nation from 2017-2019, particularly those doing ok and doing comfortably.
We see a decline in perceptions across all groups during and after the pandemic, but the decline was largest among those doing comfortably.
In every year, folks doing better themselves see their community / the nation as doing better.
Notice too that the gap between local and national is largest among those doing the best, and grows larger among those doing the best. We can see that if we visualize the difference between the two lines.

Folks not doing so well don’t have too much difference or trend between how they perceive their community and the nation. Folks in this category have the most pessimistic outlook and apply it across all levels. But look at the comfortable - they have the massive gap between their perceptions of their local community and the nation as a whole. So perhaps the “vibecession” applies primarily to those who are overall financially comfortable. Hey, those are just the kinds of people to subscribe to the Atlantic and Substacks!!
Let’s do the same stratifying among those doing better / same / worse than the year before.

And now the difference between the lines:

Pretty much the exact same set of results. Folks who are doing worse than the year before / struggling financially have broad pessimism about their community and the nation. Those doing comfortably / doing better than the year before have the “Vibecession” where they have different views of themselves, their community, and (especially) the nation.
Things are probably pretty normal
Michigan’s Consumer Sentiment site has a great graph that shows values among the richest and poorest deciles:

Richer folks are, unsurprisingly, more optimistic about the economy than poorer folks.
The gap seems pretty consistent over time.
Sentiments converged during the Great Recession and in 2021-2022.
Sentiments seem to have diverged to normal levels in 2023.
I suspect the “vibecession” was a temporary blip that probably also occurred in a similar way during the Great Recession.
Conclusion
I think that folks probably have a good sense of economic conditions. The percentage of folks doing worse than the previous year increased by almost 25 from 2019-2022. How could that not have a recession-like effect? The vibes differentiating those doing well and the country as a whole are totally concentrated among those doing well, which is probably folks reading the types of articles written on vibecessions.
This is all kind of a detour from inequality change. What does this have to do with inequality? (1) I think the greater optimism about the economy was detectable in consumer sentiment data and the federal reserve data used in this post. I doubt that the broader “vibes” of inequality decline / improving economic conditions have been totally unnoticed. (2) I’m still curious whether folks realize inequality has declined. I’ll need to dig into different survey data for that.