

Inequality Readers. Mobility Decline?
Be careful how you measure things. It tends to matter.

This week I’m going to look at two recent articles by someone who is perhaps sociology’s top inequality scholar.
Absolute Mobility Has Some Problems
You probably have heard of the results from this paper:
Specifically, you might have seen this graph.
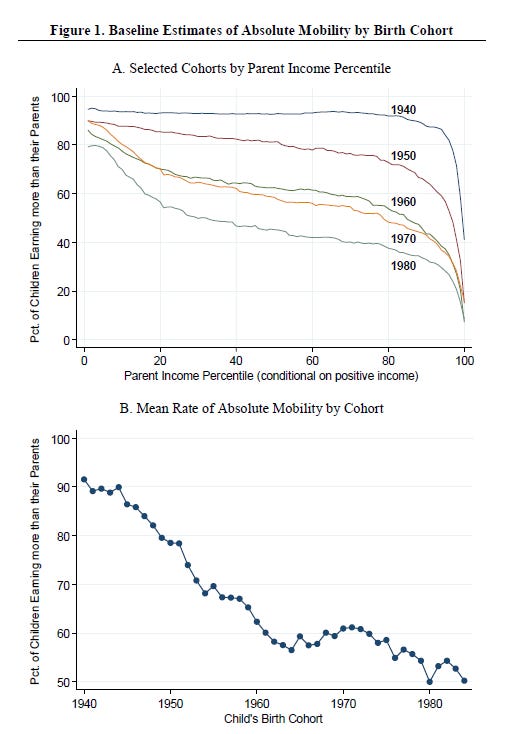
A massive decline in absolute mobility, or the percent of children who earn more than their parents. Noble and magnificent older Millennials, like myself, only have a 50/50 chance of out-earning their parents.
Oh no! What terrible news!
… Or … is this news primarily rooted in niche and esoteric decisions of mobility measurement?
In comes Deirdre Bloome. Bloome is one of, if not the, best sociologist studying inequality today. Her work is extremely complex and sophisticated, which means that it doesn’t really break out into the mainstream that often. But … she’s probably the best out there! The more Deirdre Bloome articles you read, the better your life will probably be.
Bloome and Opacic (BO) published an incredible article on mobility last year:
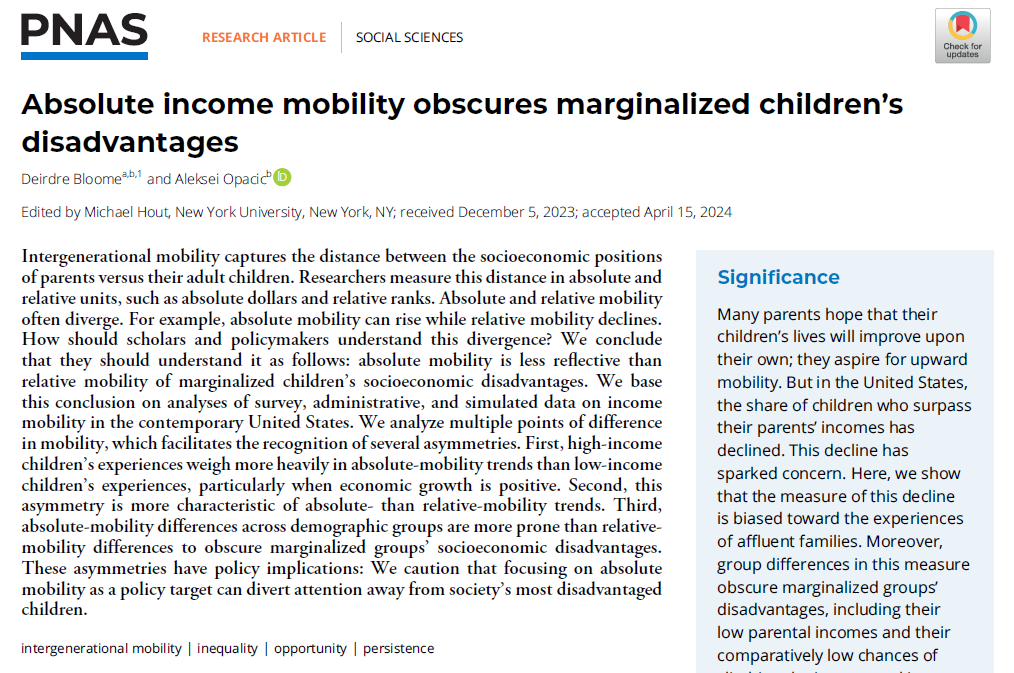
People care about intergenerational mobility: the difference in the socioeconomic attainment or economic standing between parents and children. It suggests how fair society is and how economic opportunity changes from one generation to the next.
There are two main ways that scholars conceptualize mobility: relative and absolute. As described by BO:
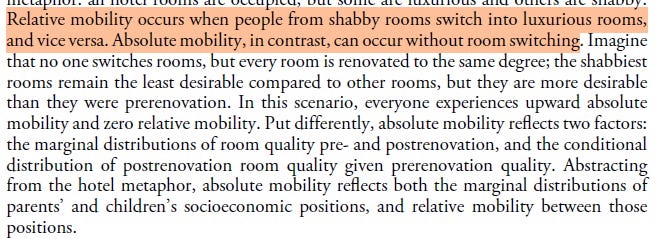
Relative: think of chopping parent’s socioeconomic standing when they’re in their 30s into three groups: bottom, middle, and top. Then take children’s socioeconomic standing when the children are in their 30s and chop it into three groups: bottom, middle, and top. Relative mobility asks about the percentage of children who move from the bottom group to the middle group and/or top group.
Absolute: Your parents made $50,000/year when they were in their 30s. One of their children earns $52,000 in their 30s. Their other child earns $48,000 in their 30s. The first child experienced upward absolute mobility. The second child experienced downward absolute mobility.
BO ask: does it matter which of these types of mobility you use in your studies?
It does! Specifically, absolute mobility tends to privilege the movements of privileged children:
And
To start out, they show that these two dimensions of mobility have diverged across US birth cohorts:
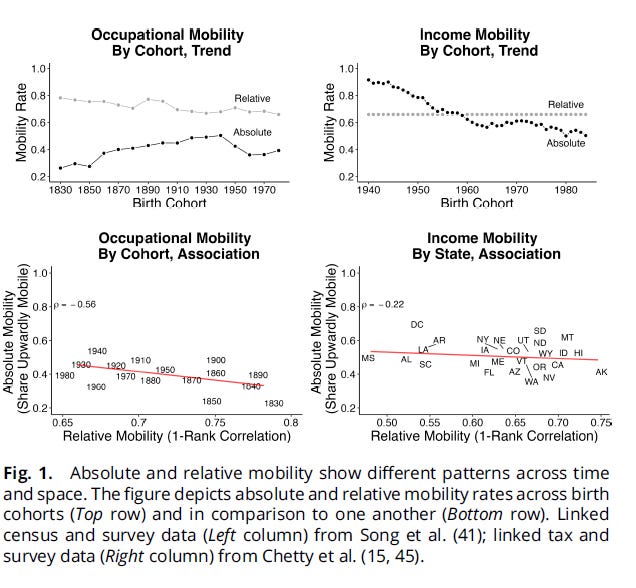
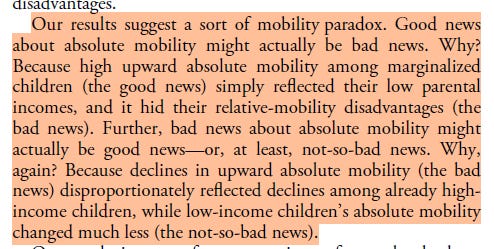
Focus on the top two graphs. We see (left) that absolute occupational mobility rose between the 1830 and 1940 birth cohorts, then declined. Relative occupational mobility declined until the 1940 or so birth cohort, then stabilized. We also see (right) that income mobility’s been going down over time since the 1940 birth cohort, whereas relative income mobility remains fairly stable.
This is what’s neat: they next calculate the contribution of children from different income origins, from poor to rich, to the overall decline of absolute income mobility. If groups contributed to absolute mobility rates equally, we would see a flat line on the upcoming graph:
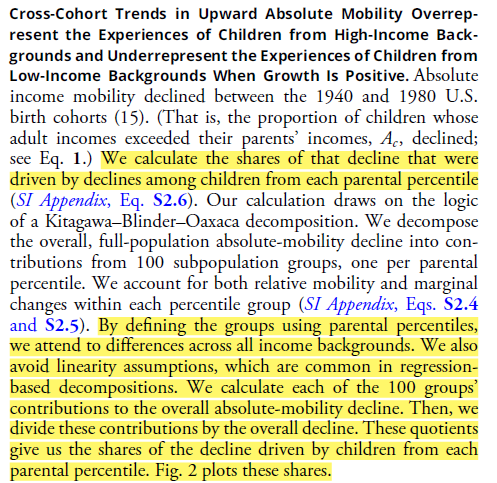
But we don’t!
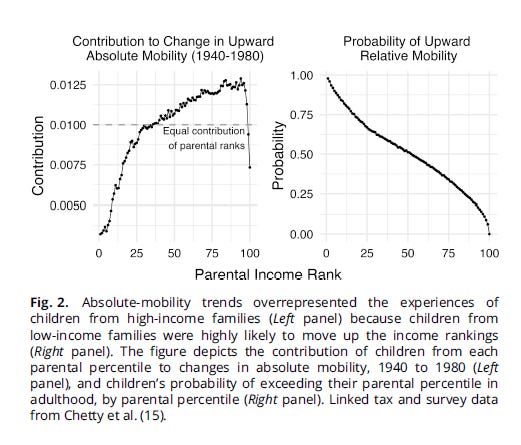
Kids in the bottom third of the income distribution “under-contribute” to absolute mobility rates, whereas kids above the median to roughly the 98th' percentile “over-contribute” to absolute mobility rates. And since “regression to the mean” works differently at the bottom and the top, the over-contributers, well, overly contribute a negative sentiment of declining absolute mobility:
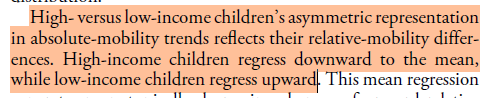
Relative mobility doesn’t have as much of a problem. BO do some sophisticated data simulations and find, well, relative mobility doesn’t suffer from this problem:
These are simulated contributions to overall mobility across parent income ranks. We see a pattern for absolute mobility and, well, a flat, albeit increasingly noisy, line for relative mobility.
Summing up:
They explore this pattern, and it is mechanically related to overall economic trends.
When incomes are growing, higher income children are over-contributors. When incomes are declining, lower income children become the over-contributors.
There is also kind of a perverse outcome of absolute mobility. Let’s look at the distribution of children across parent income, based on parent’s education:
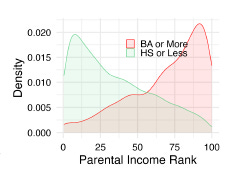
Folks with high education parents tend to be in richer locations. Folks with less educated parents tend to be poorer.
This ends up overstating the mobility of the more vulnerable group when we use absolute mobility measures. Relative mobility measures tend to be either more muted or pessimistic.
The big payoff:
Absolute mobility probably shouldn’t be a policy objective. Getting good mobility measures is just really hard and there always seems to be some major tradeoff.
They go on to briefly propose a new mobility measure. I didn’t find it super compelling or do-able, so I’m ignoring it. The meat of the paper is this very important critique of mobility measurement. It really matters how you conceptualize and measure mobility, because that will probably influence what you find.
So don’t worry about us magnificent older Millennials, at least in terms of absolute mobility. It’s how the measure is measured. Things are still bad, but in more normal ways (for better or worse). But that all culminates to mean: we might not have rocketed into a dire hellscape.
Marriage and Migration
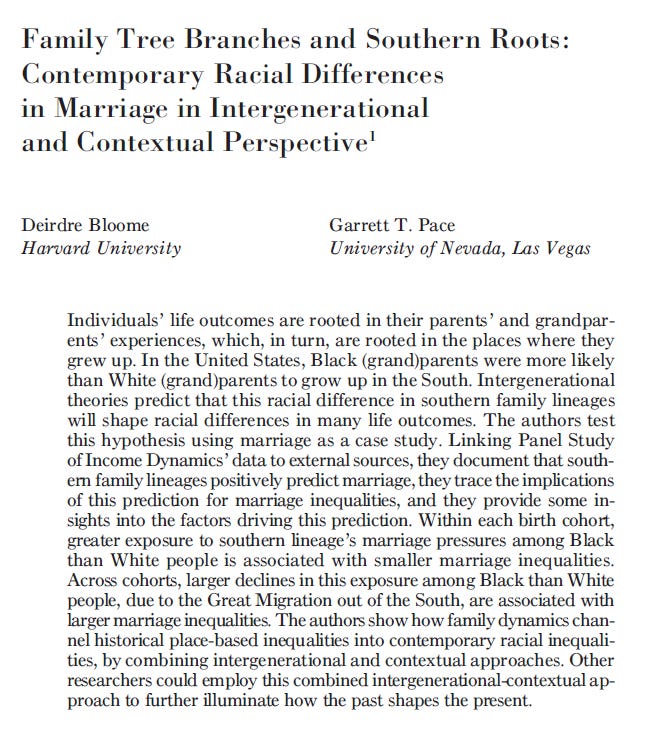
Let’s keep a focus on recent studies published by Bloome. This article was pretty wild. It is … just weird and interesting. To what extent does the culture that is bounded up in the geography of your grandparents’ residence affect your life outcomes? And does that influence your odds of getting married? AND … do racial inequalities and uneven migrations out of the South contribute get bundled up into all this!? That’s the weirdly massive bundle of questions that this paper sets out to answer.
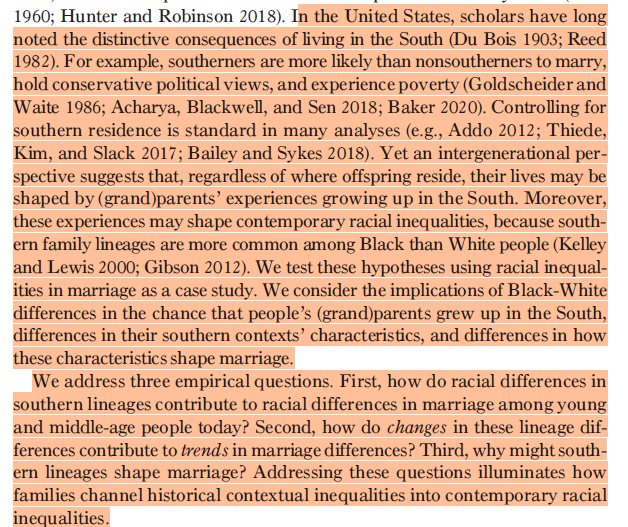
Basically: South - non-South is a major difference in the US context. Part of that major cultural difference is marriage. Folks in the South have higher marriage rates than folks outside of the South. Bloome and Pace focus on the gap in marriage rates across this geographical context. And then ask: how does this cultural difference explain racial differences in marriage patterns … how does migration out of the South affect changing marriage rates across racial groups … AND how does the long arm of grandparent legacy affect all this? Wild!
Paper’s Methodological Guts
The authors use a wonderful dataset, the Panel Study of Income Dynamics (PSID), and complement it with a few other data sources.
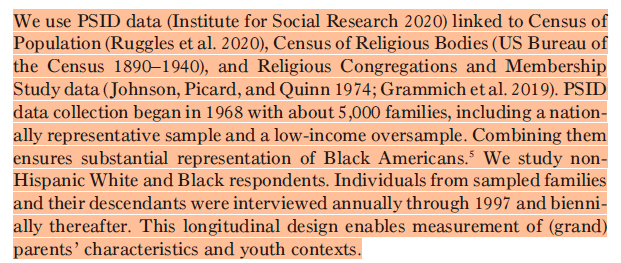
The PSID is a long running panel dataset that tracks individuals, their families, and their descendants over time, beginning in 1968.
Bloome and Pace follow cohorts born roughly in 1970 and 1990, watching their patterns of marriage by the age of 40.
They measure the Southern lineage of the family’s grandparents, parents (1970 birth cohort) and children (1990 birth cohort).
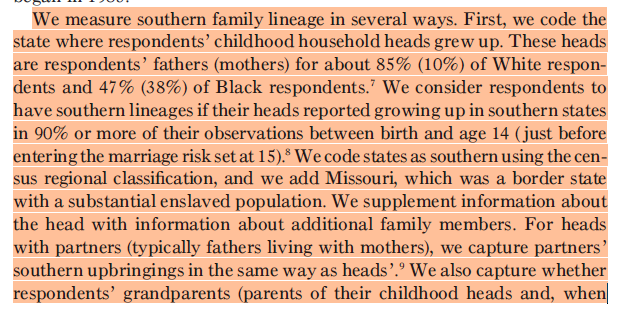
They include a bunch of information at the individual and the state level, including state contextual information of (1) religiosity and (2) racial composition.
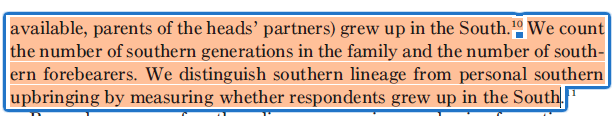
They use two fairly straightforward set of methodological techniques (don’t worry … it gets less straightforward in a second!):
This is a regression model that is appropriate for a binary outcome (e.g. married or not).
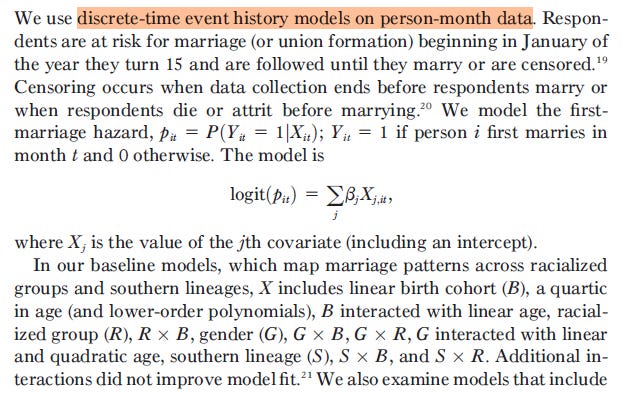
They then put a small casual inference twist on their models, using something called g-estimation:
Think of g-estimation as a technique that addresses messy issues of tangled relationships between your key treatment of interest (Southern lineage) and your outcome (marriage). This can arise from factors the researcher can’t see, which ultimately messes up the pattern of Southern lineage and marriage that exists within people’s life course. g-estimation “peels away” certain problematic effects of Southern Lineage on marriage until the relationship looks more like a randomized trial (e.g. randomly giving some people aspirin, other people a placebo), ultimately leaving a cleaner direct relationship between the two.1
And then: it wouldn’t be a Bloome paper without a frantic rending of estimated values into their subcomponents.
(tangent: below is why Bloome is the top in the profession, but not a household name. Her methodological work is complex. If there’s one way to define it, it would be decomposition, or the mathematical breaking apart of an overall effect into sub-effects, naming the sub-effects, and then breaking them apart into sub-components. Makes for great and pathbreaking research, not so much a 2 minute NPR blurb.)
We have gaps in prevalence and predictive effect. Think of prevalence as the contribution to the overall effect based on Southern lineage across groups. Think of predictive effects as the difference strength across racial groups that Southern lineage has.
The second equation basically says: the changes in the racial gap over birth cohorts can be parsed into not just predictive and prevalence effects, but also migration effects - as folks migrate out of the South, we would expect the influence of the South on their marriage to decline!
Results
OK - let’s look at the results!
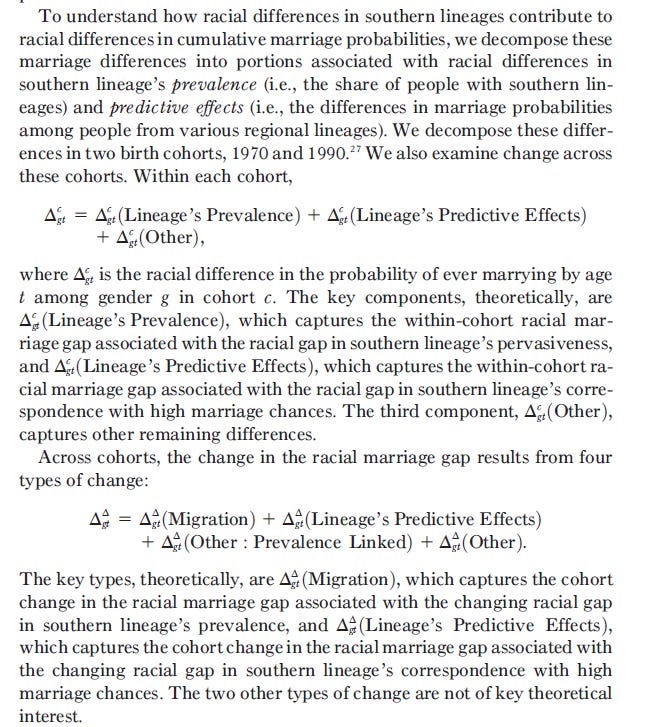
We see different levels of marriage, an overall decline of marriage, and different rates in the decline of marriage.
Over time, even though everyone’s marriage rates have declined, Black folks’ rates have declined faster than White folks’ (see the rising line in the far right graphs).
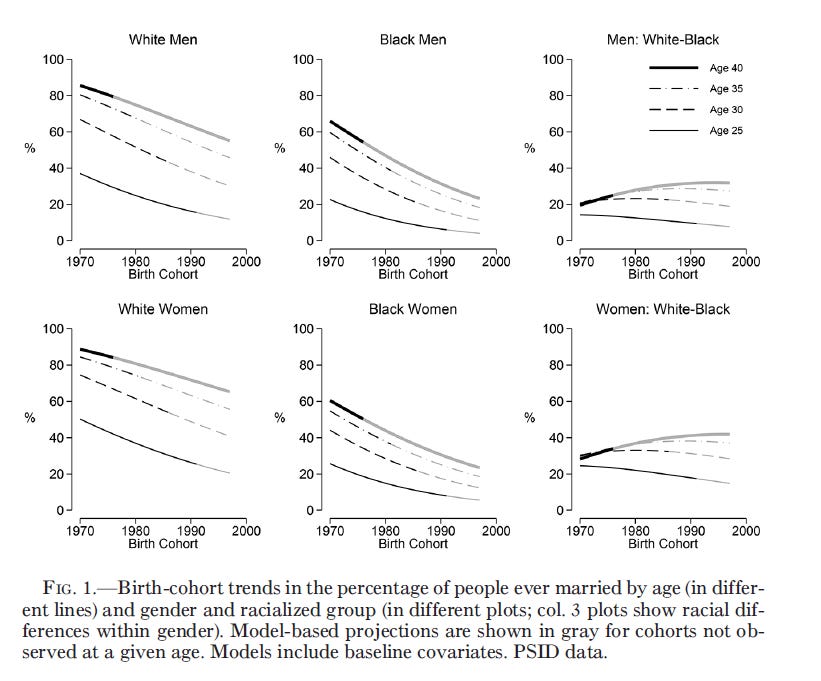
Black people have migrated out of the South, and that has resulted in, well, fewer Black households headed by Southerners.
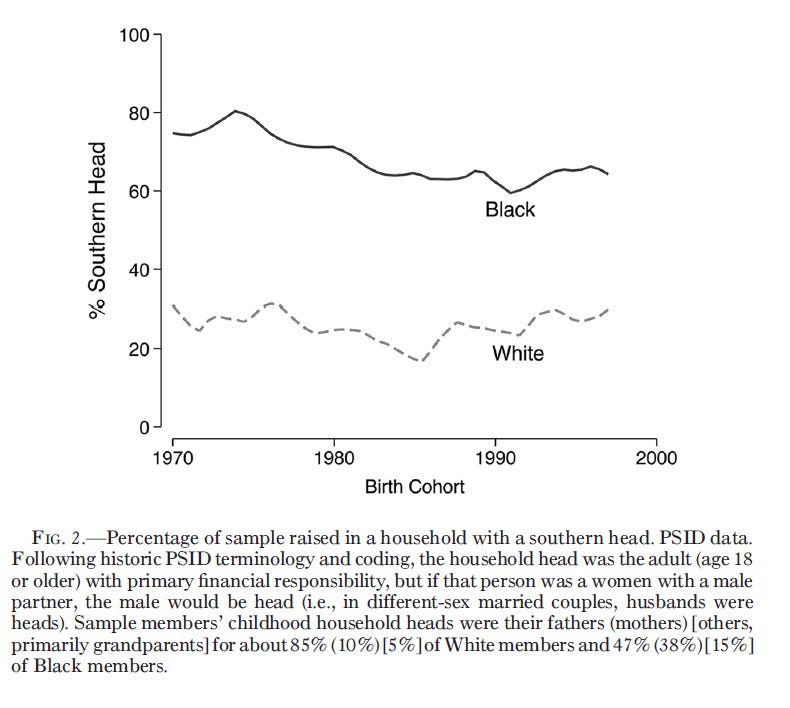
We see fairly similar marriage gaps between Black and White people born in and outside of the South.
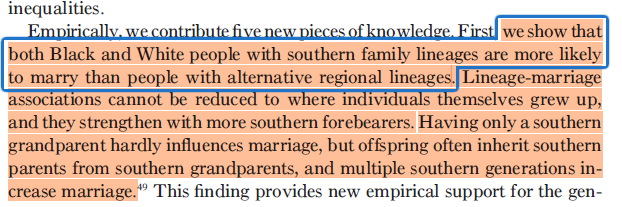
Southern linear is predictive of marriage. This is found across a whole slew of measures of Southern lineage
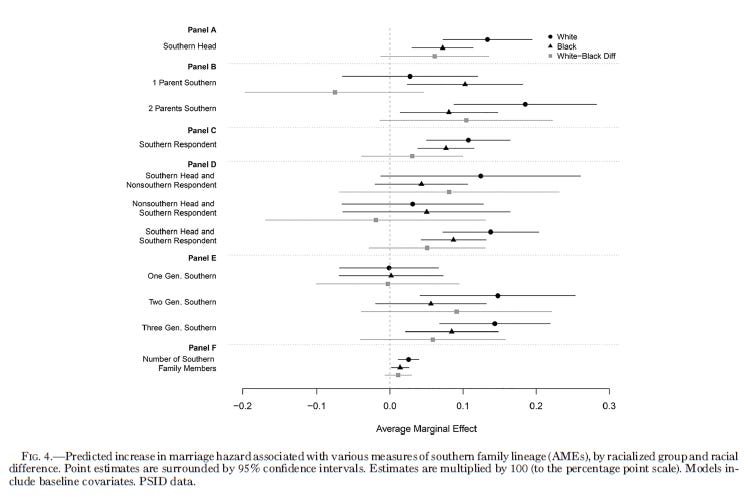
Basically, along the rows we have a whole slew of measures of Southern lineage. If the dots are to the right of the vertical dashed line, then Southern lineage positively predicts marriage. We see … Southern lineage to just simply predict marriage.
The differences in Southern lineage between Black and White people helps explain differences in marriage rates.
The findings can get a little wild, and they are presented in tables of counterfactuals and counterfactual decompositions. Here’s a taste:
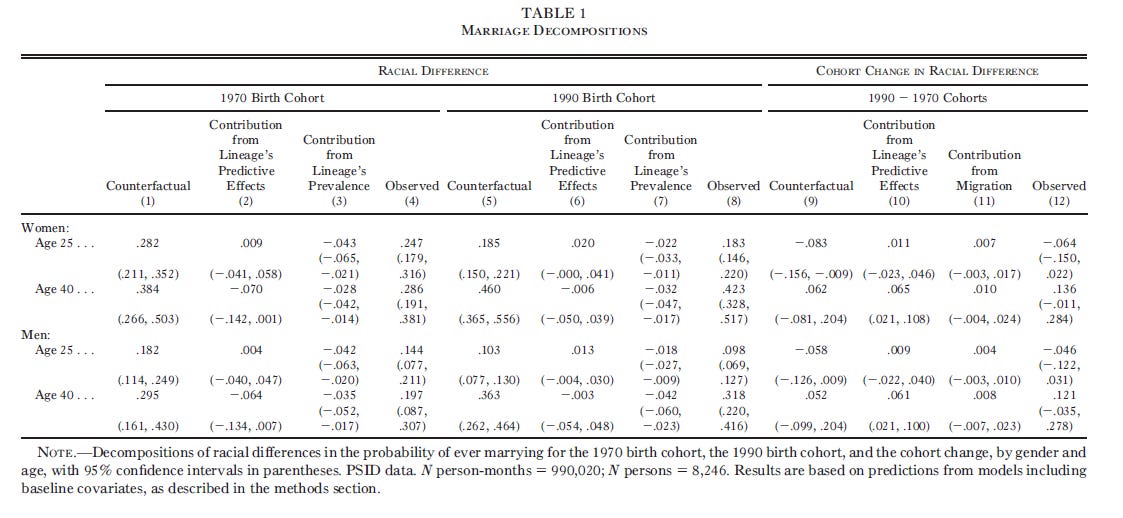
There is just … a lot going on. It’s not reasonable to aim a blog post at this. Remember, Bloome’s whole methodological M.O. is to rip apart an overall effect into smaller effects. She’s doing that here, and figuring out how to attribute an overall gap in marriage between Black and White people to different sub-categories of explanations.
… not the best type and presentation of results to include in a blog post! So let’s hop ahead to their main findings:
First:
Southern lineage, especially both Southern grandparents and parents, boosts the probability of marriage, generally.
Second:
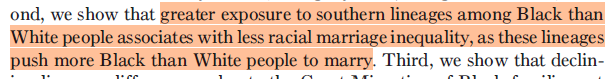
This Southern lineage effect tended to equalize marriage rates between Black and White respondents.
Third:
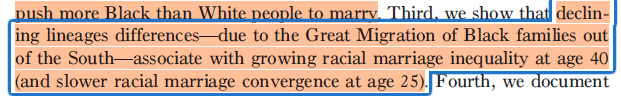
the Great Migration to the West, Midwest, and Northeast reduced Black Southern lineage, weakening the Southern marriage influence, increasing marriage gaps between Black and White Americans.
Fourth:
… ok! Maybe this is interesting to people who study marriage. Doesn’t seem like a big deal to me, but: ¯\_(ツ)_/¯ . Sure!
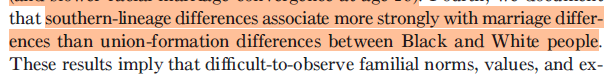
Fifth:
e.g. structural reasons why the South boosts marriage - agricultural employment, church membership - are detectable … only for White individuals.
So what we’re seeing here … regional culture affects individual behavior. But … it ALSO influences individual behavior by affecting family culture which … influences individual behavior! And we see a weird consequence of the Great Migration - it moved lots of Black individuals out of the South, which weakened the Southern effect on marriage and increased marriage inequality.
We end up in a place where racial disparities are partially the product of a big tangled web of: geography, culture, migration, and family lineage. I am a sucker for these kinds of explanations, and I am impressed that Bloome and Pace were able to square a focus on these bigger factors with a causal logic that often demands precise and narrow treatment structures. Very interesting!
One tricky thing about these kinds of techniques - they still rely on you doing everything else correctly. My gut sense is that these are tools that can get you closer to a correct answer. They’re not magical salves that spin gold out of bad data.
As soon as economists stop looking at metrics like Gini and start looking at wealth concentration, asset ownership, or class mobility, they'll start to notice.
Just because it doesn't exist in their spreadsheets, doesn't mean its false