

There's no more college wealth premium?
I doubt it strongly.

I recently read an article in the New York Times that talked about the downfall of college, Americans Are Losing Faith in the Value of College. Whose Fault Is That?.

Part of this was the claim that the college wealth premium (wealth as in your assets minus your debts) had functionally declined to near-zero among those born in the 1980s. From Tough’s article:
Then the researchers looked at the wealth premium, and a different picture emerged. Older white college graduates, those born before 1980, were, as you might expect, a lot wealthier than their white peers who had only a high school degree. On average, they had accumulated two or three times as much wealth as high school grads of the same race and generation. But younger white college graduates — those born in the 1980s — had only a bit more wealth than white high school graduates born in the same decade, and that small advantage was projected to remain small throughout their lives.
Here’s an infographic that was included in the New York Times magazine article showing the changes to the wealth premium over time, for White and Black folks.

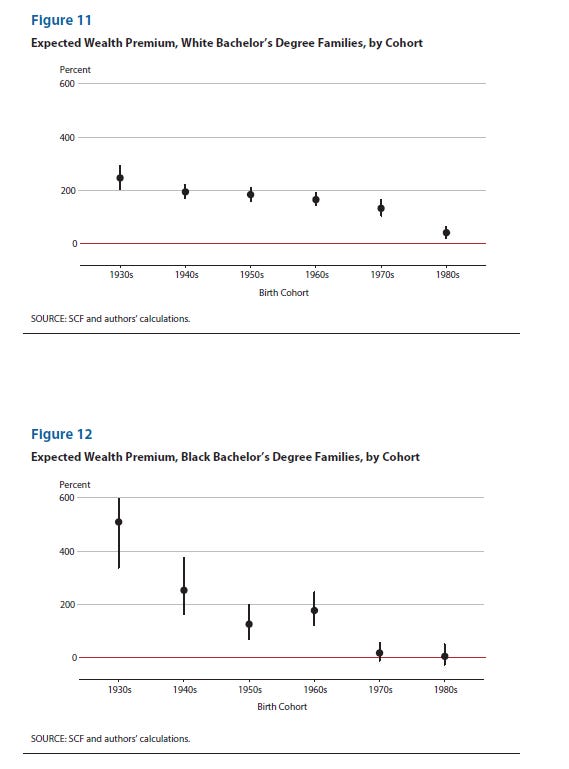
You see a ~200 and 250% wealth premium for college-educated folks born in the 1940s compared to those without a high school degree, which shrinks to ~ 0 and 50% for those born in the 1980s.
This removal of a wealth premium undercuts the legitimacy of college and changes the calculus of whether young adults should attend college. From Tough’s podcast with Derek Thompson, Plain English, the two basically accept that the wealth returns to college have substantially declined, and they then move on to speculate why (humanities majors, debt, etc). Big if true.
Does this argument make sense? No.
Sit back for a second and think about this argument. Do you really think that the typical wealth level between college and noncollege workers has gone to zero, or near zero, among those in their mid 30s through mid 20s? Do you really think “only a bit more” is a good description of the difference? Do you know what the noncollege labor market looks like? FYI - not great. Take a look at work by Case and Deaton.
I am very confident that we have not undergone a massive boom of noncollege wealth. I’m sure it has stayed way down near zero. So the only way that the end of the college wealth premium could have happened would be if college wealth cratered to near zero.
Ask yourself: do you think that happened?
There’s a massive income gap, but no wealth premium?
The NYT article is based on a paper by some folks at the Fed Reserve, which also states that the income premium for college is alive and well! It’s just that this massive income gap doesn’t translate into wealth.
…somehow? Below are figures for the continued college income premium.

Has there been a decline in the income premium? Yes, from about 75% income premium to those born in the 1930s to about 50% for those born in the 1980s (white families) or a steady 60 - 75% income premium among black families. But it looks like a roughly 50% premium is relatively stable for those born in the 1950s onward. That is, we don’t see too much of a dip in income levels for the college educated.
…Are you really, really telling me that this annual 50% income boost makes NO movement into wealth? I could see that as possible if all college workers lived in either San Francisco or Brooklyn, but they don’t! I just don’t see how this income movement can translate into a non-wealth effect. There are major education differences in: home ownership, fringe benefits, marriage. I just can’t see a realistic way these things don’t translate into big wealth differences.
The article is based mostly on a working paper from the San Francisco Fed: Is College Still Worth It? The New Calculus of Falling Returns by Emmons, Kent, and Rickett.
Here’s their visualization of their main declining wealth finding:
What about post-graduates?
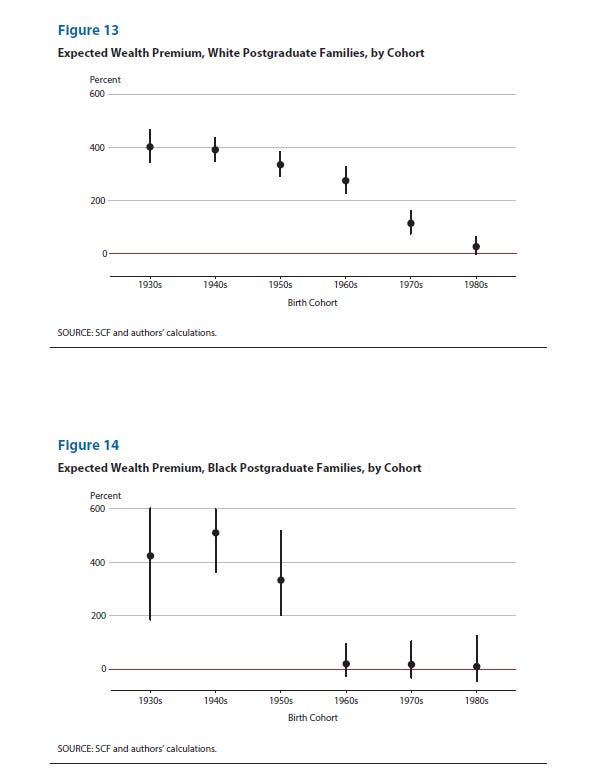
Look at Figures 11 and 13 again. Wealth premium has declined for both BA holder and post grad holder. But… the coefficient is indistinguishable from zero in Figure 13, which is our post-grad folks. It’s positive but small for just BA folks.
What’s your reaction to these figures?
Is it: Oh no! Post graduates born in the 1980s have no more wealth than those with a high school degree! This explains why Millennial doctors are so often seen as living in the exact same economic conditions as Millennial landscapers.
Is it: This is why I told my granddaughter not to become a doctor - it does nothing for wealth accumulation compared to that sweet, sweet world of BA only wealth accumulation.
Or is it: something is off.
Economists take the first swing
Rothwell basically solves it
The most obvious critique was made by Jonathan Rothwell in a tweet that was not nearly as viral or widely read as the NYT article or the podcast:

Let’s zoom in on this graph

Wealth, unsurprisingly, builds and accumulates with age. We see among young people pretty wild fluctuations before 30 prior to 2010. We see that the gap in wealth between BA holders and some college collapses after 2010 —- but we don’t see a similar collapse among those in their 30s, which is when small amounts of wealth developed in younger ages would begin to accumulate and expand. We ALSO see that there are non-constant age effects - the education premium for those in their 30s is much larger in the 2010s than a similar effect among those in their 30s in the 1990s. The original paper just controls for age, which wouldn’t get at time-varying age effects.
But also - the Emmons paper, and Tough article, speak about folks born in the 1980s. But their data are only collected through 2016

So that means that the sample born in the 1980s will be, at oldest, 36 years old. The youngest will be 27. Even if you simply adjust for age in your regression models, there’s just a lot of risk in comparing a sample of folks in their 50s through 80s over the whole period of study to those who just enter the labor market in the last two or three waves and are in their early 30s. A dicey proposition. A lot can go wrong that might lead to apples-to-oranges comparisons.
Deming brings up the life course
David Deming has a nice Atlantic article that makes a very compelling pushback against the Tough magazine article and Emmons et al paper. He similarly links to Rothwell’s tweet (I promise I started working on this before Deming’s article came out!!). He also says the following:
Historically, analysis of higher education’s value tends to focus on the so-called college wage premium. That premium has always been massive—college graduates earn much more than people without a degree, on average—but it doesn’t take into account the cost of getting a degree. So the St. Louis Fed researchers devised a new metric, the college wealth premium, to try to get a more complete picture. They compared the wealth premium of people born in the 1980s with that enjoyed by earlier cohorts. Because those earlier generations have been alive longer and thus have had more time to build wealth, the researchers projected out the future earnings of the younger cohort. They found that the lifetime wealth premium will be lower for people born in the 1980s than for any previous generation.
That analysis, however, suffers from a key oversight. In estimating the lifetime earnings for people who are now in their 30s and early 40s, the researchers assumed that the college wage premium will stay constant throughout their life. In fact, it almost surely will not. For Baby Boomers, Gen Xers, and older Millennials, the college wage premium has more than doubled between the ages of 25 and 50, from less than 40 percent to nearly 80 percent. Likewise, the college wealth premium for past generations was initially very small but grew rapidly after age 40. History tells us that the best is yet to come for today’s recent graduates.
Wages grow faster for more-educated workers because college is a gateway to professional occupations, such as business and engineering, in which workers learn new skills, get promoted, and gain managerial experience. Most noncollege workers, in contrast, end up in personal services and blue-collar occupations, for which wages tend to stagnate over time.
For example, truck drivers in the U.S. earn an average annual salary of about $48,700, according to my analysis of data from the American Community Survey. (Full-time unionized drivers can make much more, but they’re in the minority.) That’s close to the average annual income for four-year college graduates working full-time at age 24. It’s easy to see why some young people might look at those numbers and opt against borrowing money to attend a four-year college. Yet the math will be very different a decade later. For example, average earnings in business occupations, where almost everyone has a four-year degree, are about $50,000 at age 24, but double to $100,000 by age 50. Average earnings for truck drivers grow from about $36,000 to only about $51,000 over the same period. The earnings advantage for college graduates increases steadily with work experience, until eventually they are earning nearly twice as much as workers with only a high-school degree.
That is a totally convincing argument regarding income differences between college and noncollege workers - income gaps that grow across the life course. Probably enough to stop there, but let’s not stop there!
Emmons at all make two claims: (1) there is a consistent income premium (2) there is a shrinking wealth premium. Deming provides an argument that extends (1) but does not counter (2). You could still conceivably hear an argument along the lines of: “Sure, the business worker earns more by 50 compared to the truck driver, but the two live in different labor markets, have different lengths of training investment, debt loads, and so we don’t see much wealth accumulation of the college worker born in the 1980s by the time they hit 50. Our declined wealth premium, argument (2), still holds.”
The third issue: time-varying education issues with hyperbolic sine transformations
OK, now we’re at the really juicy stuff that people want to talk about! Emmons et al. transform wealth to make its super-skewed distribution work a bit nicer. Now, their decision is totally normal and, from what I can tell, frequently applied in econ wealth studies. No shame about it. I transform wages using the natural log in my own work to normalize skewed distributions. But I think that the transformation used in the Emmons et al paper bakes a shrinking college-noncollege wealth gap into the cake. This issue combines with the age issue Rothwell and Deming note to result in a seemingly shrinking wealth premium when wealth education gaps probably aren’t shrinking.
This issue was missed by the New York Times. Check out the fine print in the New York Times figure above

It says that the graph shows the percent difference of median family wealth of college versus noncollege. It does not. Those percentage differences are obviously grabbed from Figures 11 and 12 that I showed above, right? Take a second and look at the first three graphs in the post. NYT grabbed the values and then made their own graph of the values from 11 and 12.
But those values aren’t for median wealth. Emmons et al. begin their paper with looking at descriptive median wealth figures, but then they move to regression analyses that use the inverse hyperbolic sine (IHS) transformation (I think this often goes by arcsine, which I’ll use as a shorthand from now on) of wealth. Below is their description.

That theta term is a tuning parameter, which they set to 0.0001:

Let’s not overstate this issue - it’s not at all a problem to transform a variable to make it less skewed. Wealth is super, duper skewed. You need to handle that in your models. But the visualization is the difference in the exponentiated coefficients of the hyperbolic sine transformation, it’s not necessarily representative of median household wealth.
This is a bit important because IHS transformation is one of the important pieces of the puzzle to argue that there is no more wealth premium.
PSID Example
I’m not super familiar with the Survey of Consumer Finances, but I’m comfortable with the Panel Study of Income Dynamics, which is a high-quality longitudinal dataset with wealth information between 1984 and 2019. Economists routinely find that economic levels, distributions, and trends from the PSID match closely to those in other high quality datasets. Let’s take a look.
I grab adult folks available between 1984 and 2019. I adjust wealth using information from the Bureau of Economic Analysis (Personal Consumption Index) to adjust wealth levels for inflation. I also adjust wealth levels by the square root of household size. I then make the IHS/arcsine transformation described above.
IHS/Arcsine Versus Observed, Logged Versus Observed

Left panel shows arsine transformation against observed wealth. Right panel shows logged wealth against wealth. A nice thing about left panel: negative values are kept. You see diminishing returns for both extreme positive and negative wealth values. So far, nothing terribly off. Just a normal transformation. But let’s take a quick look at a comparison of observed and arcsine wealth distributions over time:

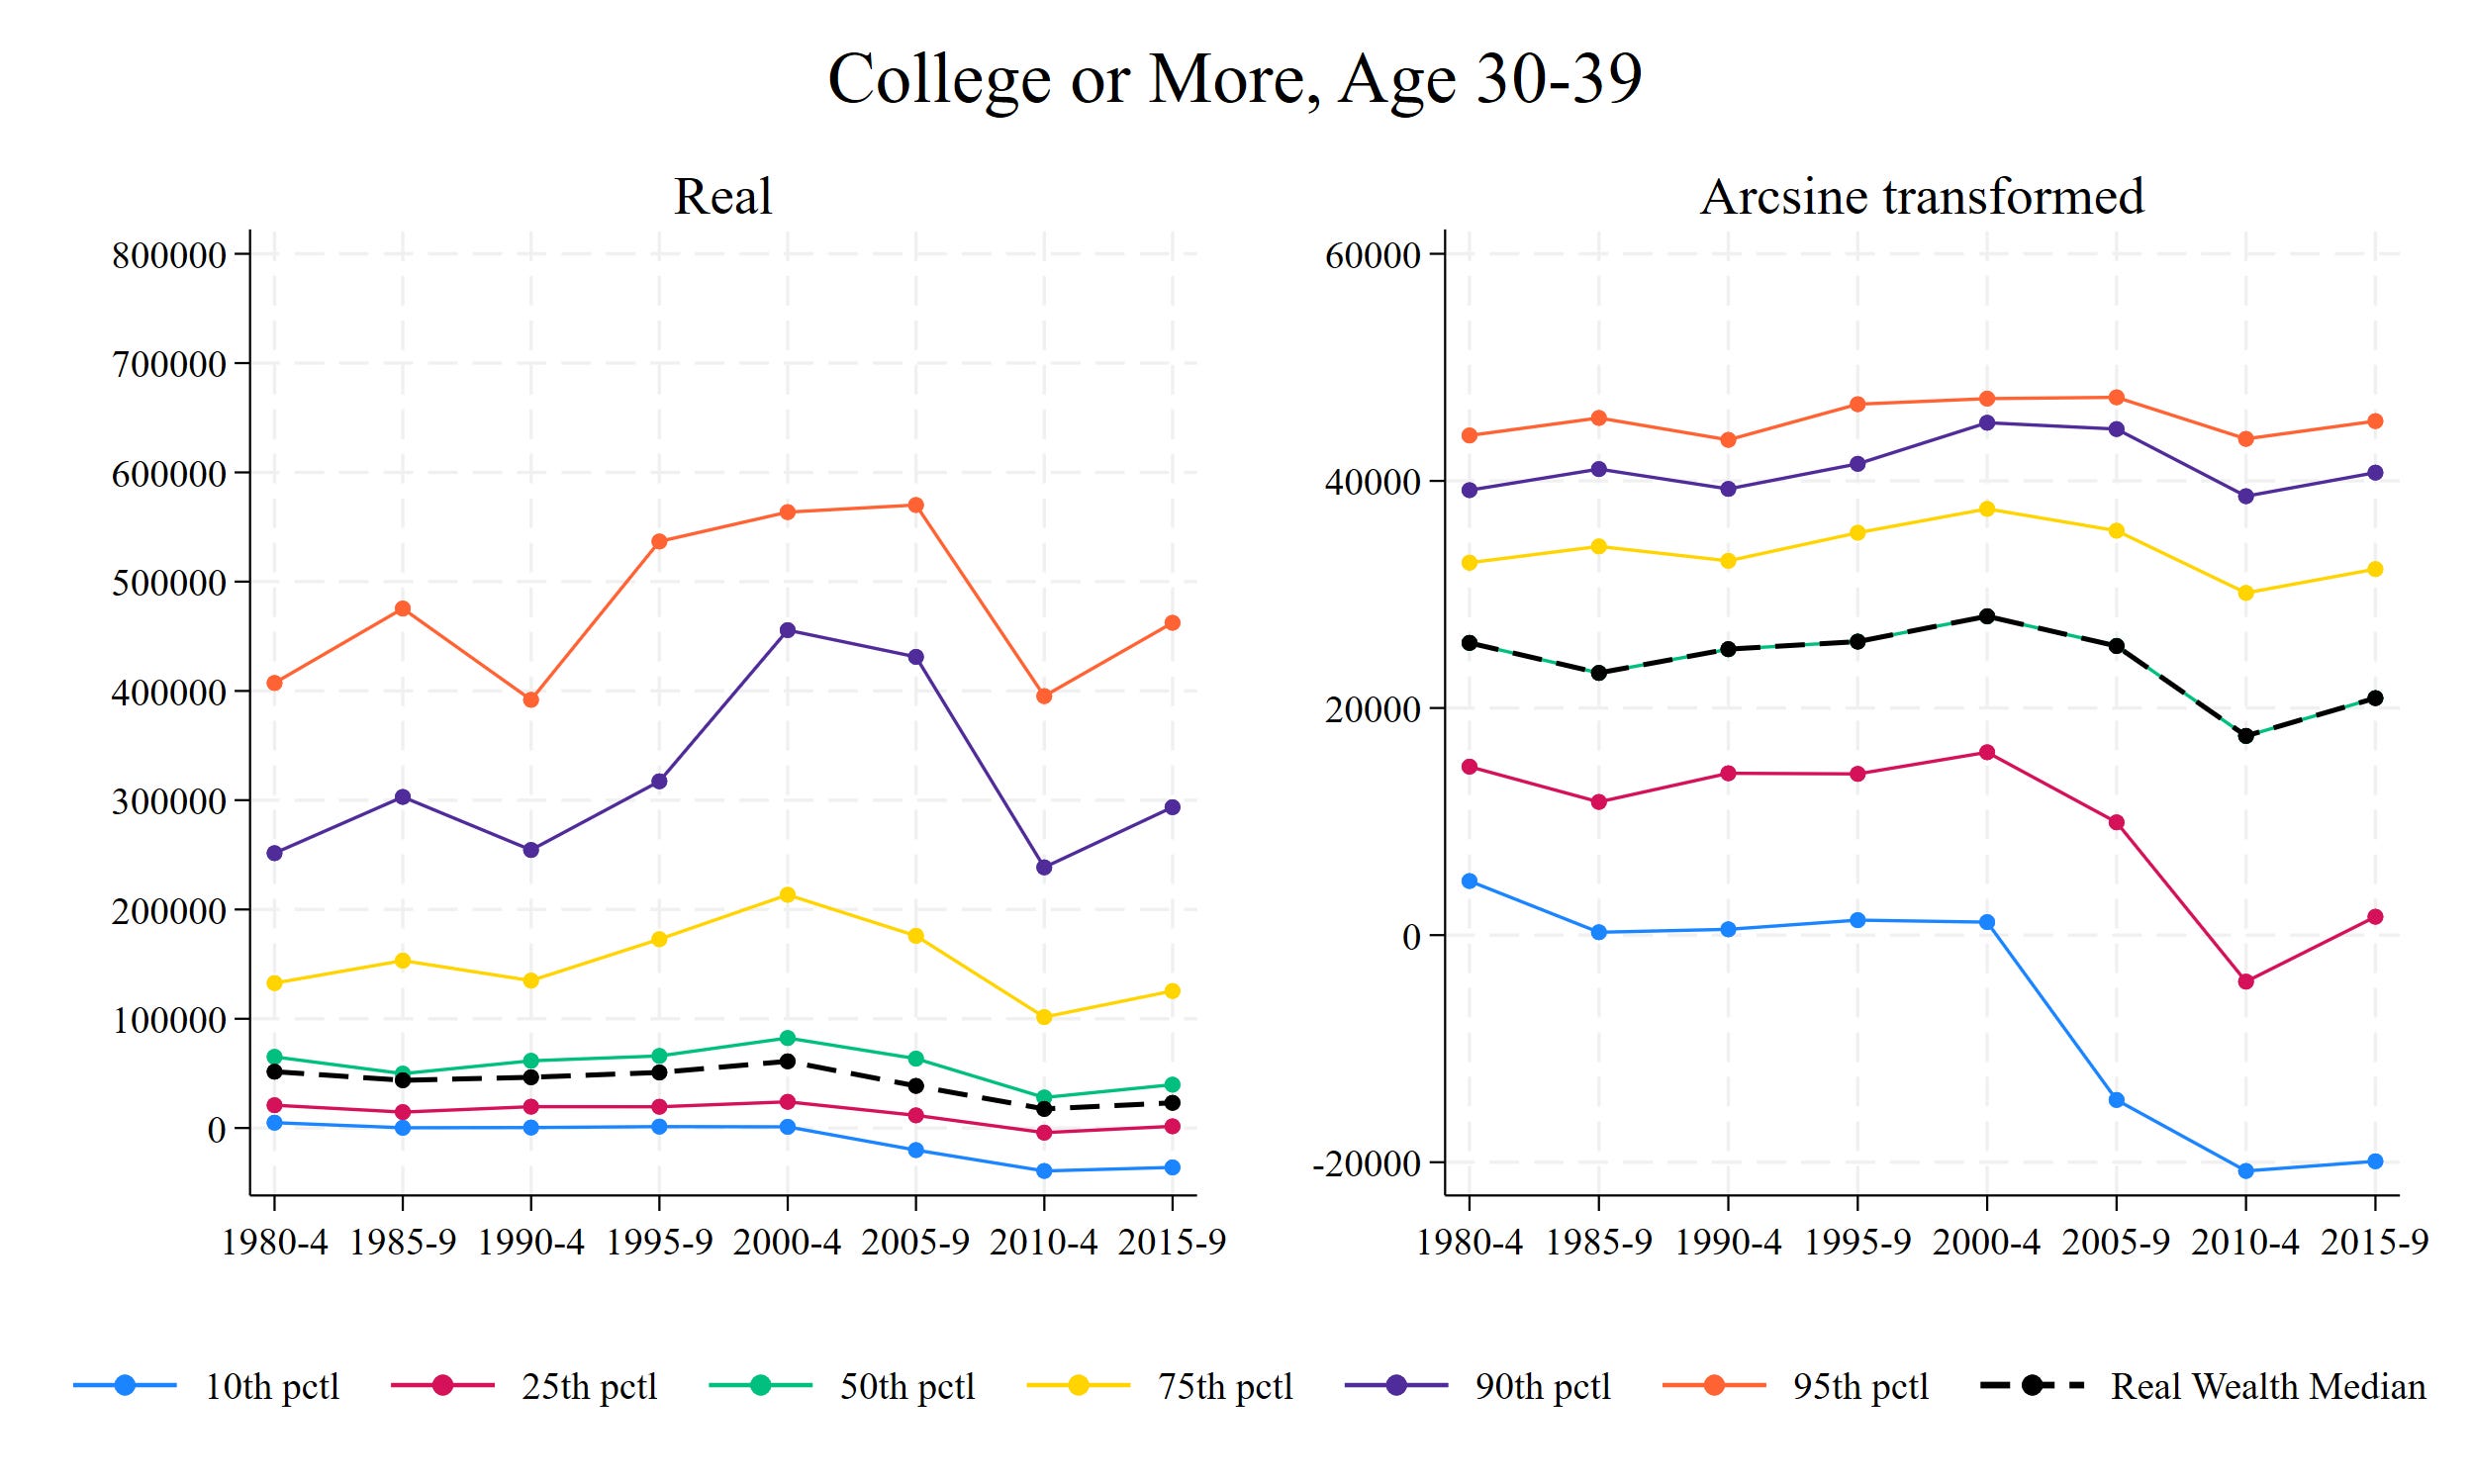
Here we’re looking at the whole adult population in the PSID, moving in half decades, from 1984 to 2019. We’re plotting wealth percentiles - the 10th, 25th, 50th, 75th, 90th, and 95th, using real wealth values in the left panel and the arcsine transformation.
If you look at the left panel: wealth is obviously super, super right-skewed. The 0-50th percentiles are all scrunched together. The 90th percentile is very far away from the 75th. The 95th percentile is skewed out even more. The IHS/arcsine transformation moves the median more to the middle - and if anything, the variable becomes slightly left skewed. But this looks like what a transformation addressed at a skewed distribution is supposed to do.
The black dashed lines: I found the mean arcsine value in each half-decade chunk and found the corresponding corresponding real wealth value. And then I found the real median wealth value and the corresponding arcsine value. So this is a way to see whether the mean of the IHS/arcsine roughly proxies the median real wealth level. As you can see, the median real wealth and mean arcsine are pretty much sitting on top of each other. Let’s look at the difference between the real median and arcsine mean values in that left panel:

A little bit of fluctuation - but nothing too awful. Looks like the mean IHS/arcsine may be a great representation of the median and I’m the one who’s super off. It relatively randomly fluctuates between -5,000 and -10,000 below the real median - nothing terrible or systematic. Perhaps you’re wondering why the y-axis goes to -$60,000? We’ll get there.
Let’s replicate this graph among two groups: those with a high school degree or less, and those with a college degree or more.

For those with lower education, the arcsine mean and the real median sit somewhat on top of one another.

For college workers, there’s a divergence. The arcsine mean for this group is much lower than the real median (look at the left panel). Let’s look at the left panel differences for these two groups:

The arcsine mean moves from a slight understatement of the median HS wealth to a slight overstatement of the median HS wealth.

Yikes - the arcsine mean wealth for college educated folks is much lower than the real median - it moves from -20,000 to -60,000 to about -30,000. Insofar as we’re using a linear regression model that computes conditional means across groups, we’re going to understate the college - noncollege wealth premium, especially in recent years, using this arcsine transformation - the trend Emmons et al. found. Let’s look at just younger individuals, those in their 30s.


Over time, the arcsine mean increasingly overstates the median wealth of less educated individuals, from -1,000 to positive 5,000, and understates the median wealth of college educated folks, from -5,000 to between -25,000 and -20,000. This transformation likely artificially pulls together less and more educated wealth levels.
Let’s actually look at regression results now. First, simple predicting arcsine outcomes with the whole 16-64 sample, controlling for age and age squared, sex, and race, and interacting education categories with decade of birth categories (you really want to exponentiate the coefficients, but the raw coefficients get the point across). Each line is the wealth premium relative to those with a high school degree or less.

Just like Emmons et al, a collapse of college premiums in more recent birth cohorts. But what if we restricted our sample just to those in their 30s, like Rothwell?

College only premium remains detectable, but declines by ~ 33%. Advanced degree wealth premiums collapse in a near linear trend across cohorts, which I find completely implausible (don’t you?).
We have another option for predicting median wealth rather than an arcsine proxy - we could predict median wealth! Labor economists use recentered influence function regression models to predict particular statistical moments, like the median. Let’s do that and see what the education premiums look like. First, for the whole sample:

Yeah - again we get a weird contemporary collapse. But that collapse doesn’t go to zero, and it is only observed in the 1980s cohort, which will have a much younger distribution within the 29-37 range. We aren’t in a weird position where we might be arguing that Millennial doctors and landscapers are indistinguishable on the wealth front.
Let’s look again for just young folks in each observed birth decade:
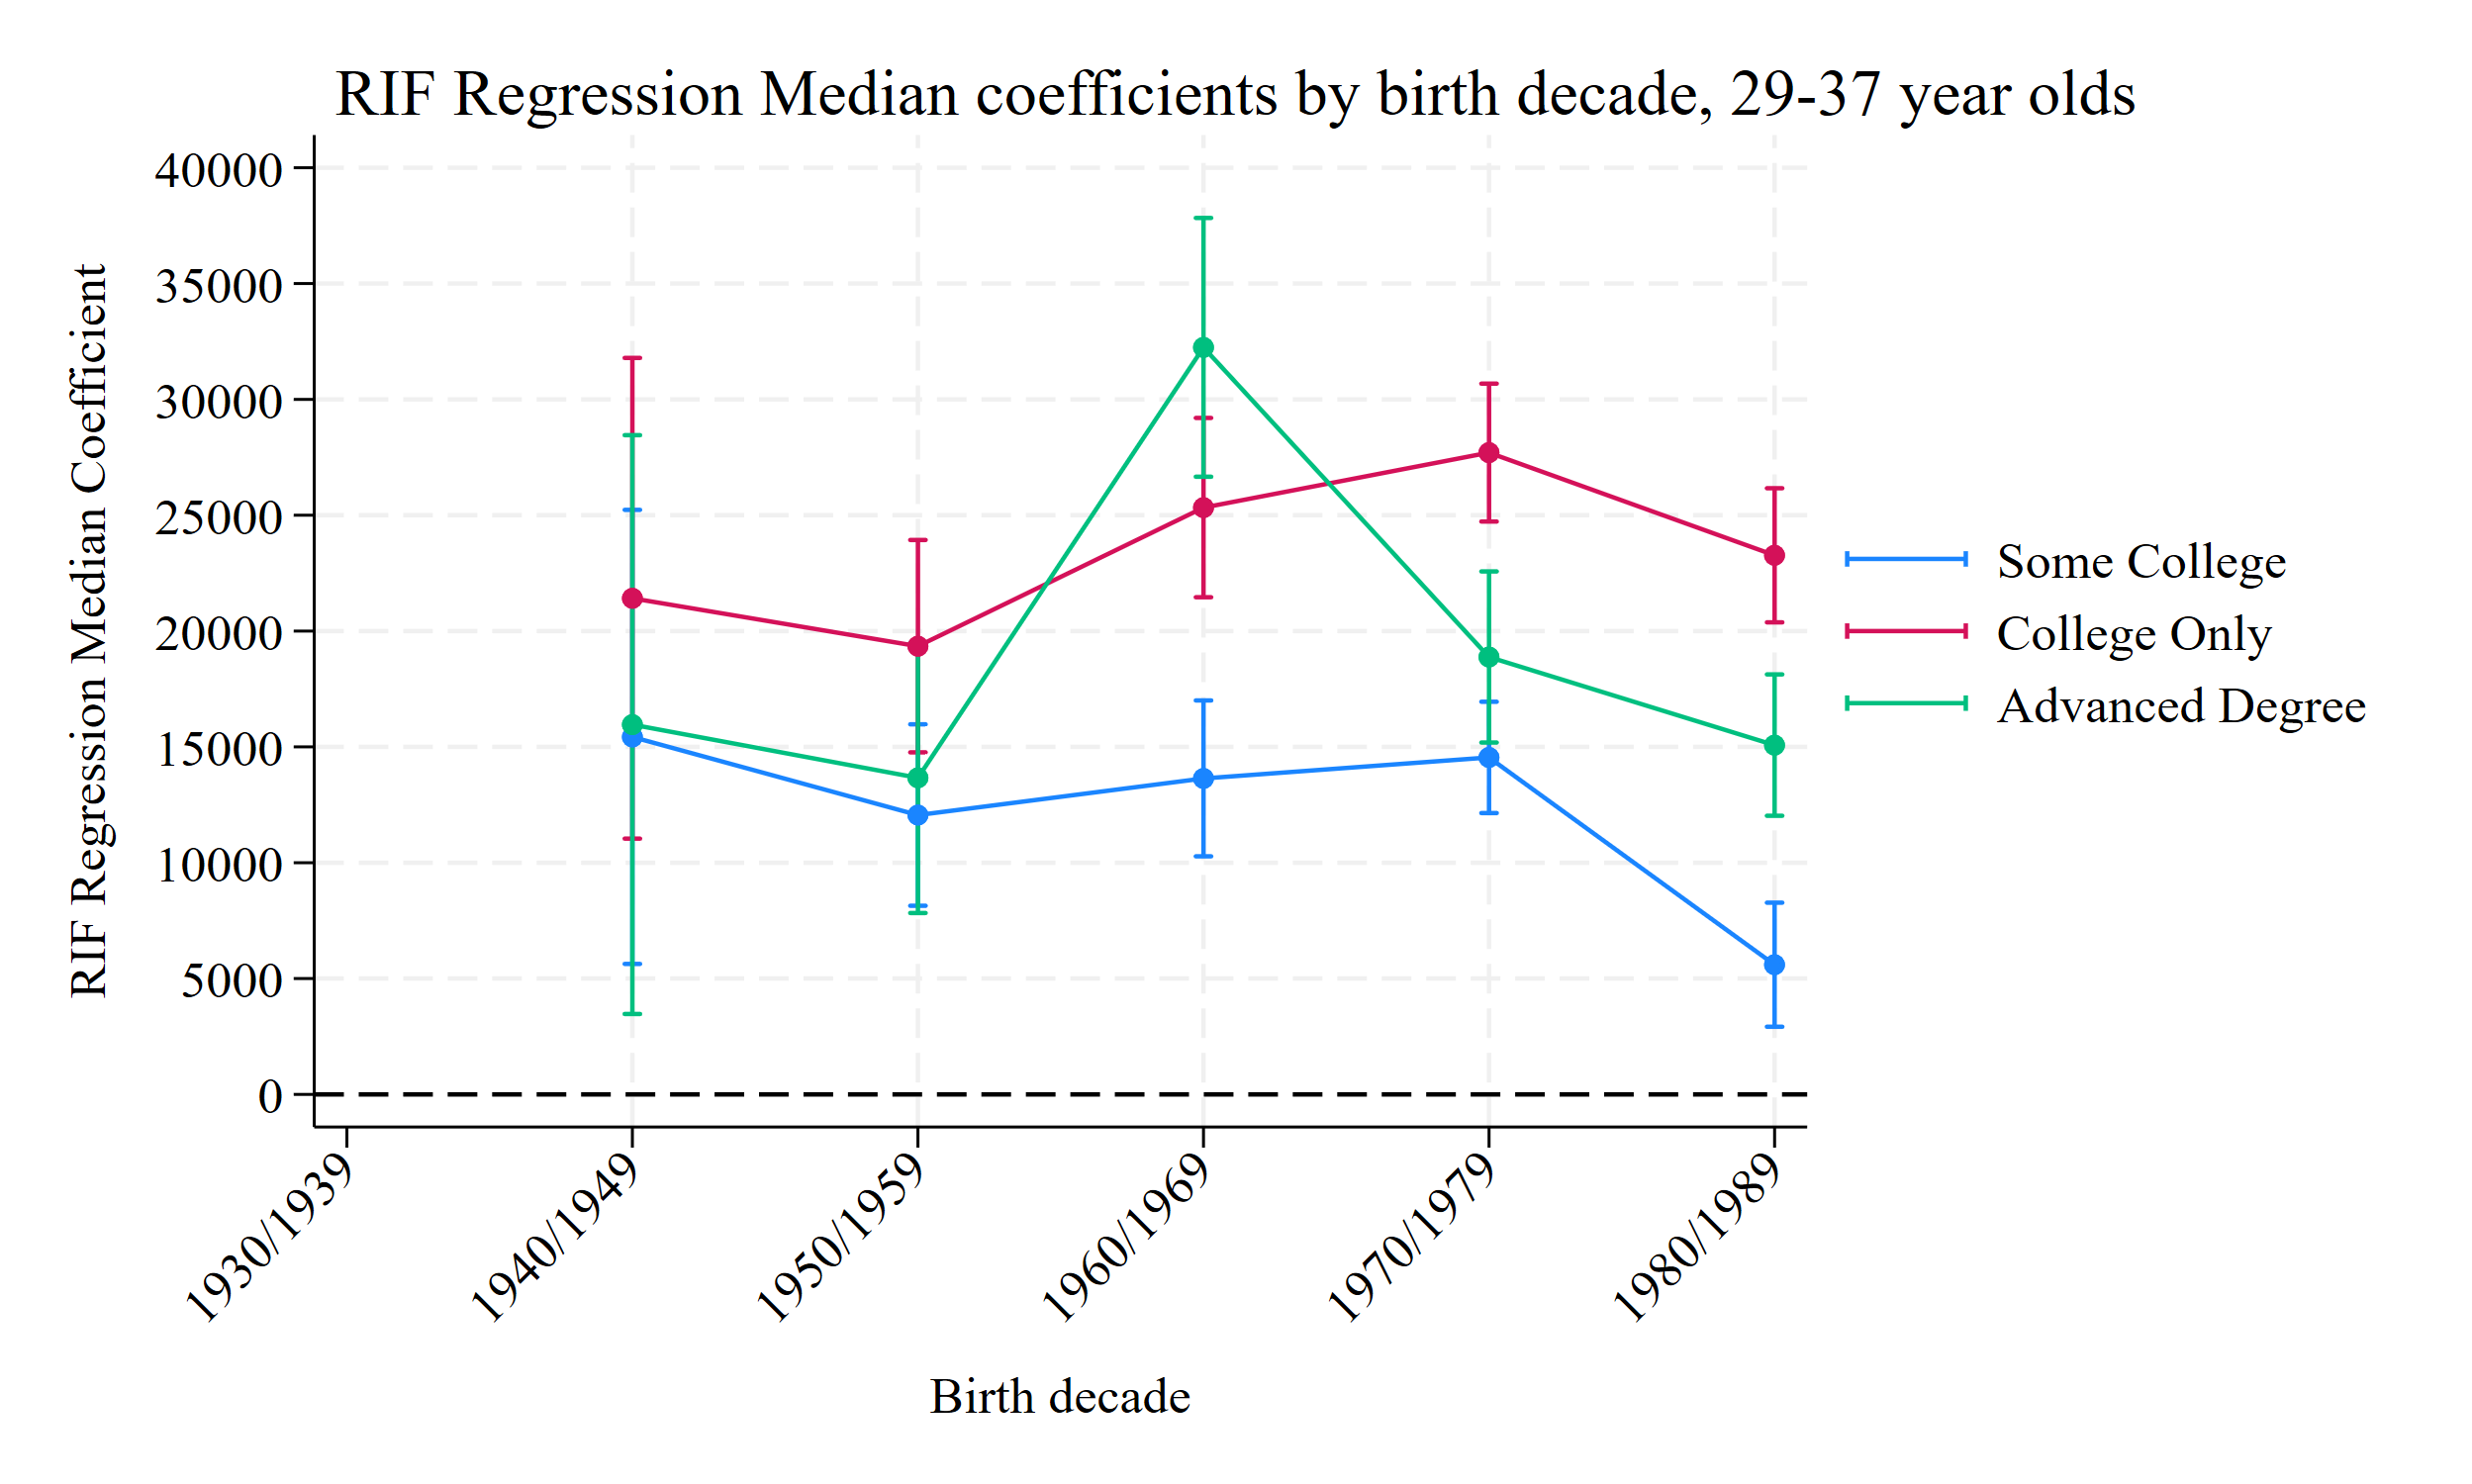
We see that the median college wealth premium has remained hovering between 20,000 and 25,000 across birth cohorts. The advanced degree holders had a massive boost in the 1960s, but have hovered around 15,000 over this decade. Some college has collapsed, as you’d expect.
This here is obviously, obviously correct, I think. It’s boring and probably won’t get nearly the wide attention as the Tough article. But it’s probably true.
I’m pretty sure the collapsing college premium is an artifact of the IHS/arcsine transformation. It increasingly pulls up low-education wealth medians over time and pushes down high-education medians. That, unsurprisingly, results in a convergence of wealth values over time. This combined with a strange modeling decision can produce a collapsed wealth premium. But when you actually model median wealth premiums among those in their 30s, there is no collapsing wealth premium whatsoever.
Remember: folks without a college degree aren’t thriving.
Let’s just look at median wealth levels by education in our PSID sample:
2015-2019: All HS or less median wealth: $16,000
2015-2019: All College or more median wealth: $78,000
2015-2019: 30-39 HS or less median wealth: $7,000
2015-2019: 30-39 College or more median wealth: $45,000
1985-1990: 30-39 HS or less median wealth: $18,000
2015-2019: 30-39 College or more median wealth: $49,000
Just not comparable groups. It’s nuts to suggest that the college strata is falling towards the high school strata. Case and Deaton have ramped up discussion again by showing the massive divergence between more and less educated life expectancy.

Deming probably makes the most succinct and compelling argument: anti-college folks got out over their skis. There are absolutely problems with the modern economy and modern higher education. But the claim that the wealth premium has nearly disappeared is just silly.
TL;DR
The college premium is not cratering. It looks that way because:
The 1980s cohort was young in the sample used in the Emmons paper, leading to funky comparisons.
Wealth and earnings grow over time at different rates for college and noncollege workers. This is missed in the Emmons paper.
The IHS / arcsine transformation accidentally pulls the college wealth median down and pushes the high school wealth median up. Combined with the funky comparisons above, this accidentally produces an incorrect removal of the college wealth premium among Millennials.
Thanks for this work, Tom. The basic lay summary: the data doesn’t capture wealth when it accumulates after age 40, as it does especially in professional (ie college requiring) work.