Do Millennials have more or less wealth than Baby Boomers?
The answer to the question might weirdly be, "yes."
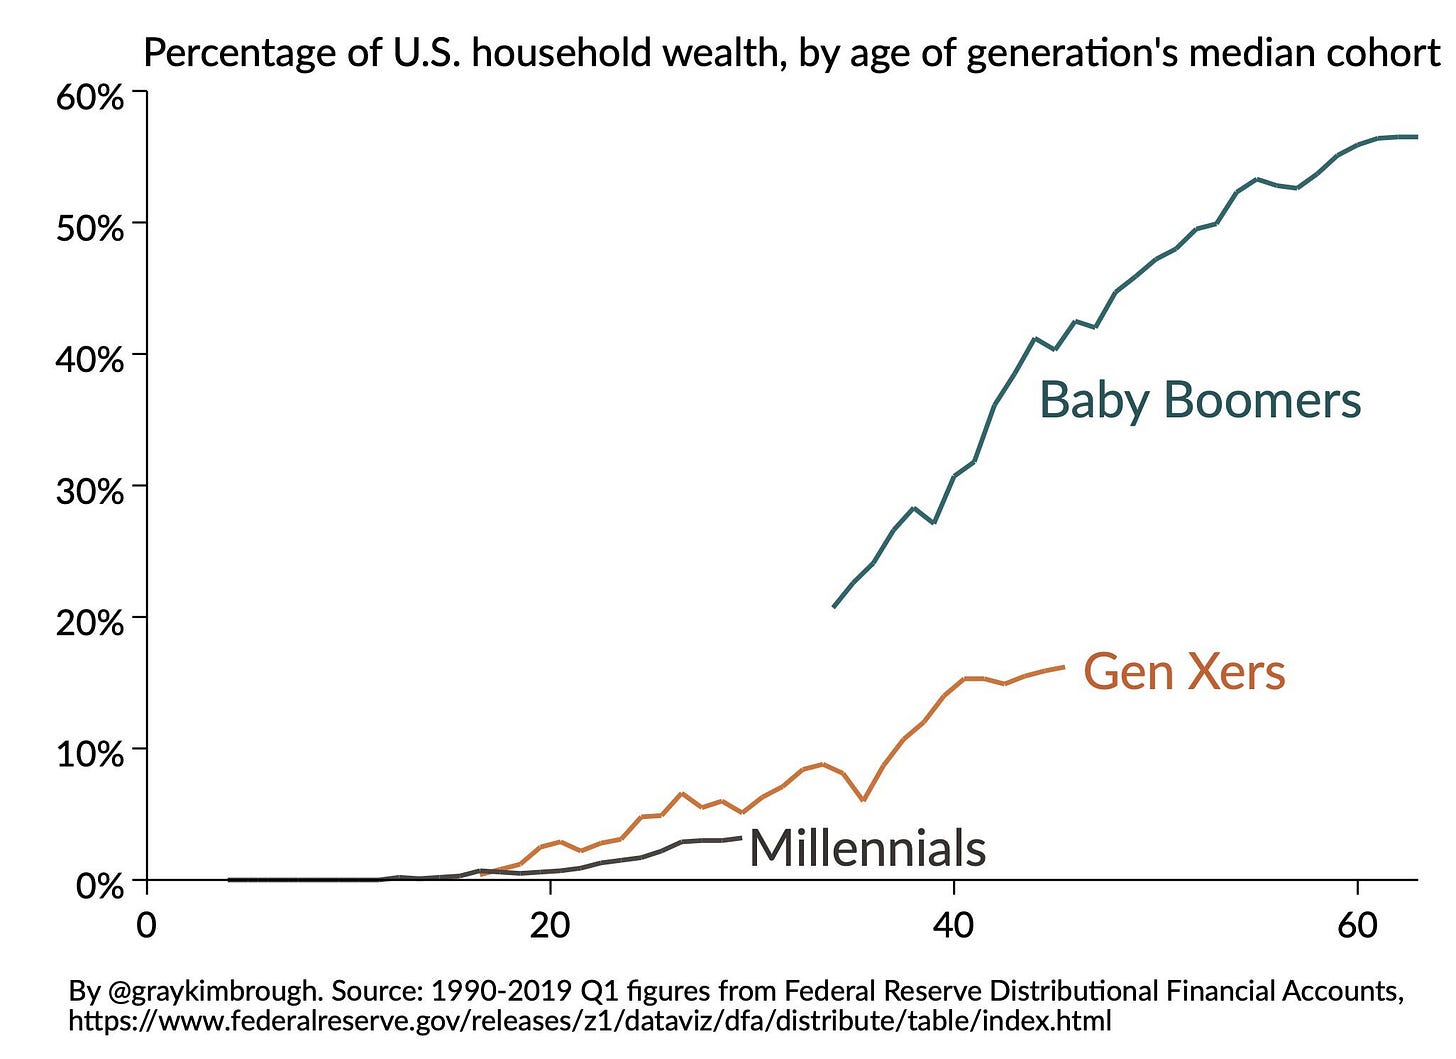
In a previous post, I wrote about wealth differences between birth cohorts. A great economics blog made a compelling argument a few years ago that when you adjust for cohort size differences, Baby Boomer and Millennial birth cohorts had roughly the same inflation-adjusted age-specific per capita wealth levels.
Adjusting for cohort population sizes transforms this graph:
into this graph
I was skeptical that this told the whole story, since it aggregated a highly unequal measure, wealth, into a single number summary. Bill Gates and I might on average be billionaires, but that masks over an ever-so-slight wealth difference between him and me. So I looked at median wealth levels and found something in between the two graphs:
A Better Answer
I’m happy to see that a great team of stratification researchers recently published a nice study on wealth differences between the Baby Boomer and Millennial cohorts
They look at wealth differences at age 35 across two high quality datasets: the National Longitudinal Survey of Youth (NLSY) 1979 and the NLSY 1997. Here’s a description of the NLY79:
The NLSY79 is a nationally representative sample of 12,686 young men and women born during the years 1957 through 1964 and living in the United States when the survey began. The survey respondents were ages 14 to 22 when first interviewed in 1979.
Here’s a description of the NLSY97:
The NLSY97 consists of a nationally representative sample of 8,984 men and women born during the years 1980 through 1984 and living in the United States at the time of the initial survey in 1997. Participants were ages 12 to 16 as of December 31, 1996. Interviews were conducted annually from 1997 to 2011 and biennially since then. The ongoing cohort has been surveyed 18 times as of date.
So we get a nice comparison of wealth levels between folks solidly in the Baby Boomer cohort and folks in the early Millennial cohort. What does Gruijters et al. find? Well, we see that Millennials have less, the same, and more wealth than Baby Boomers, depending on where in the wealth distribution we look.
This description graph looks at wealth levels along deciles (e.g. lining up each cohort from poorest to richest, then dividing up each cohort into 10 equally sized groups, and then taking the mean wealth level in each of these 10 groups).1
We see that in the six least wealthy groups, Millennials have less wealth than the Baby Boomer cohort. In the lowest category, we see a difference of zero wealth for aged 35 Baby Boomers and negative wealth (e.g. more debts than assets) for the least wealthy Millennials.
But then look at percentiles 80 and 90 - wealthy Millennials have overtaken wealthy Baby Boomers, especially at the top-end of the wealth distribution - the wealthiest Millennials typically had ~$450,000 at age 35, whereas the wealthiest Baby Boomers had ~$375,000.
The rest of the paper is basically variation around this descriptive point. What are the cohort-specific sources of wealth?
We see that home equity was very important in increasing Baby Boomer relative to Millennial wealth through the 70th' percentile. We see that non-financial assets are more concentrated among lower-wealth Millennials relative to similar Baby Boomers (this would be things like cars, jewelry, trademarks), above-median Millennials have more financial assets than similar Baby Boomers, especially wealthy Millennials, and less-wealthy Millennials have way more debt than similar Baby Boomers.
The authors then go on to use a variety of distributional regression and decomposition techniques to assess big-class differences in wealth (big classes below):
and they also look at life course changes in career trajectories using a statistical technique called sequence analysis (e.g. you look at changes in these big class locations that individuals fall in across different waves of a longitudinal dataset):
The basic findings here are unsurprising on my (very) quick read - higher status and professional Millennials are zooming ahead and are the main location of the big intercohort wealth boost, and there is quite a bit more inequality in wealth among Millennials than among Baby Boomers.
To be honest, I don’t love this part of the paper, which ends up being the big majority of empirical results. It’s in a more European tradition of stratification research. These big classes and this type of longitudinal analysis are pretty standard in British, German, and Dutch studies of inequality. That’s totally fine, but if we’re going to get technical, I’m more of a microclass kind of guy (e.g. studying finer grained differences in occupations - looking at differences between lawyers, software engineers, and nurse practitioners rather than lumping them together). But I digress…
Can I find the same thing?
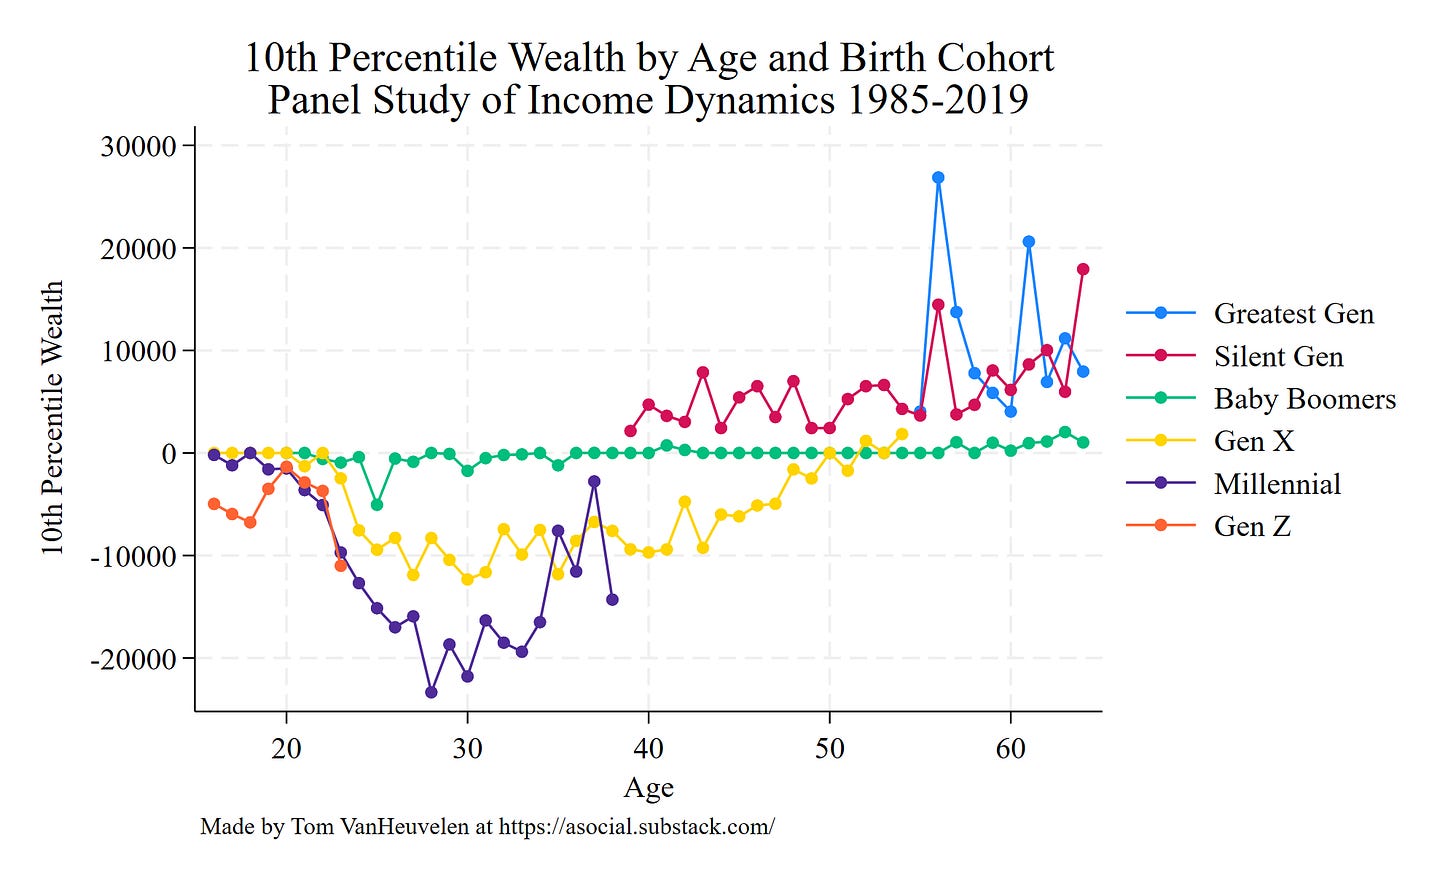
I’m going to use a dataset I’m familiar with and that I used in the last blog post - the Panel Study of Income Dynamics. Let’s look at wealth differences among lower wealth folks (e.g. those at the lowest 10th percentile of wealth in their birth cohort) and higher wealth folks (e.g those at the 90th percentile and 95th percentiles).
Here are 10th percentile results
Yup, the least wealthy Millennials are about $17,500 less wealthy than similarly aged Baby Boomers. We see that Generation X is consistently $10,000 less wealthy than similarly aged Boomers also. And this difference is basically due to Baby Boomers having zero wealth and Millennial and Generation X cohorts having more debt than assets.
How about the top end of the distribution?
At the 90th percentile of wealth, we see that Millennial and Generation X cohorts are as wealthy, or a tad wealthier than Baby Boomers.
There’s an odd big spike of wealthy Millennials just at college graduation ages, and then a rough similarly across ages.
How about at the 95th percentile?
Yup - the wealthiest Millennials and Generation X folks are consistently quite a bit wealthier than the similarly-aged wealthy Baby Boomers.
We can describe the wealthiest Millennial and Generation X cohort members as consistently ~ $100,000 wealthier than their Baby Boomer equivalents. It looks like Generation Z will follow the same trend.
OK - now let’s compare Baby Boomers, Generation X, and Millennials across every point of the wealth distribution. Let’s restrict focus to folks aged 32-37. And let’s look at the relative wealth levels of Millennials and Generation X’ers to their Baby Boomer equivalents.
Below the dashed black line - the younger cohort members are less wealthy than their Baby Boomer equivalents. Above the line, the younger cohort members are wealthier than their Baby Boomer equivalents. The shaded areas are 95% confidence intervals, so if the horizontal black line falls in there, we might say that we can’t functionally differentiate the two birth cohorts.
Interestingly enough, below the 70th percentile (Generation X) and 75th percentile (Millennial), younger cohorts are consistently about $10,000 less wealthy than their equivalent Baby Boomers. But then, above the 85th percentile (Generation X) and 90th percentile (Millennial), younger cohorts are much wealthier than their equivalent Baby Boomers.
Are Millennials less, or more, wealthy than Baby Boomers?
Yes. The answer’s yes.
Most Millennials are less wealthy than their equivalent Baby Boomers. But the wealthy Millennial, and the wealthy Gen X’er, are much wealthier than their Baby Boomer equivalent.
Again, the two graphs that I led this blog post with are probably only kind of incorrect. The graph suggesting that Millennials are in a devastating hellscape are wrong. Or, at least they are wrong for 90% of the cohort. But the graph suggesting no difference averages over most Millennials doing modestly worse and the wealthiest Millennials doing much better.
The truth seems to be dependent upon context, conditional, and requires more than one single snappy figure to get a real meaty understanding.
Actually - I’m not sure if they’re looking at the mean of ten groups covering the whole sample, or if they’re looking at wealth levels at these ten specific percentiles in the distribution. The description in the paper wasn’t terribly clear. I think either decision would yield similar findings, but it’s worth noting that these are two distinct decisions a person could make to look at distributional descriptive statistics that would yield somewhat different results.


